Bayes' theorem
Our goal is for you to come away from this lesson understanding one of the most important formulas in probability, Bayes’ theorem.
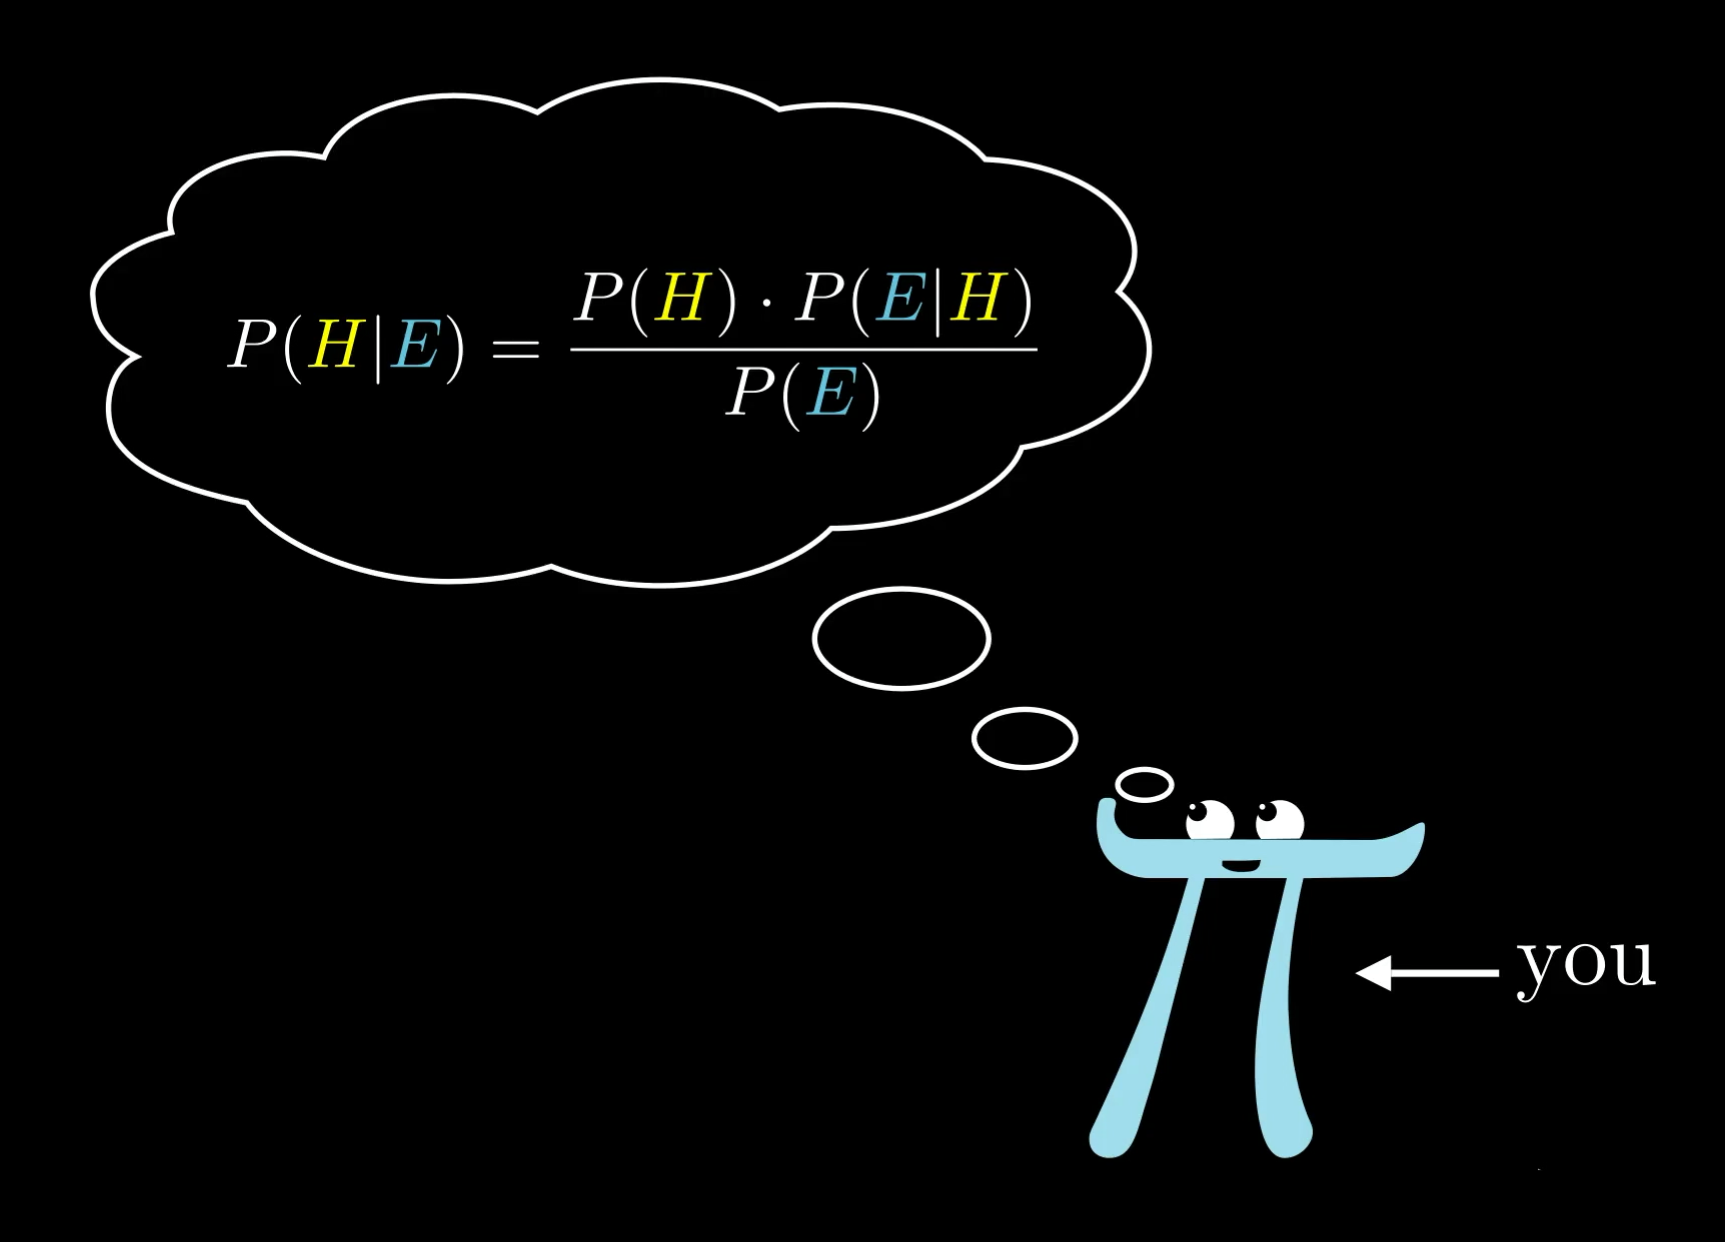
This is you, soon...
This formula is central to scientific discovery. It’s a core tool in machine learning and AI, and it has even been used for treasure hunting! In the 80’s a small team led by Tommy Thompson used Bayesian search tactics to help uncover a ship that had sunk a century and half earlier carrying $700,000,000 worth of gold (in today's terms). So it's a formula worth understanding.
But of course, there are multiple levels of understanding:
- The simplest form of understanding is just knowing what each part of the formula means, so you can plug in numbers.
- Then there’s understanding why it’s true. Later I’ll show you to a diagram that’s helpful for rediscovering the formula on the fly as needed, which only really works if you understand the why of Bayes' theorem.
- The final level of understanding is being able to recognize when you need to use it.
With the goal of gaining a deeper understanding, you and I will tackle these in reverse order. So before dissecting the formula, or explaining the visual that makes it obvious, I’d like to tell you about a man named Steve.
Steve
Steve is very shy and withdrawn, invariably helpful but with very little interest in people or in the world of reality. A meek and tidy soul, he has a need for order and structure, and a passion for detail.
Which of the following do you find more likely: “Steve is a librarian” or “Steve is a farmer”?
Some of you may recognize this as an example from a study conducted by the psychologists Daniel Kahneman and Emos Tversky. Their work was a big deal. It won a Nobel prize, and it has been popularized in books like “Thinking, Fast and Slow”, “The Undoing Project”, and several others. They researched human judgments, with a focus on when these judgments irrationally contradict what the laws of probability suggest they should be.
The example with Steve, the maybe-librarian-maybe-farmer, illustrates one specific type of irrationality.
According to Kahneman and Tversky, after people are given this description of Steve as “meek and tidy soul”, most say he is more likely to be a librarian than a farmer. After all, these traits line up better with the stereotypical view of a librarian than of a farmer. And according to Kahneman and Tversky, this is irrational.
Their objection is not that people hold correct or biased views about the personalities of librarians or farmers. It’s that almost no one thinks to incorporate information about the ratio of farmers to librarians into their judgments.
In their paper, Kahneman and Tversky said that in the US there are about 20 farmers for every 1 librarian.
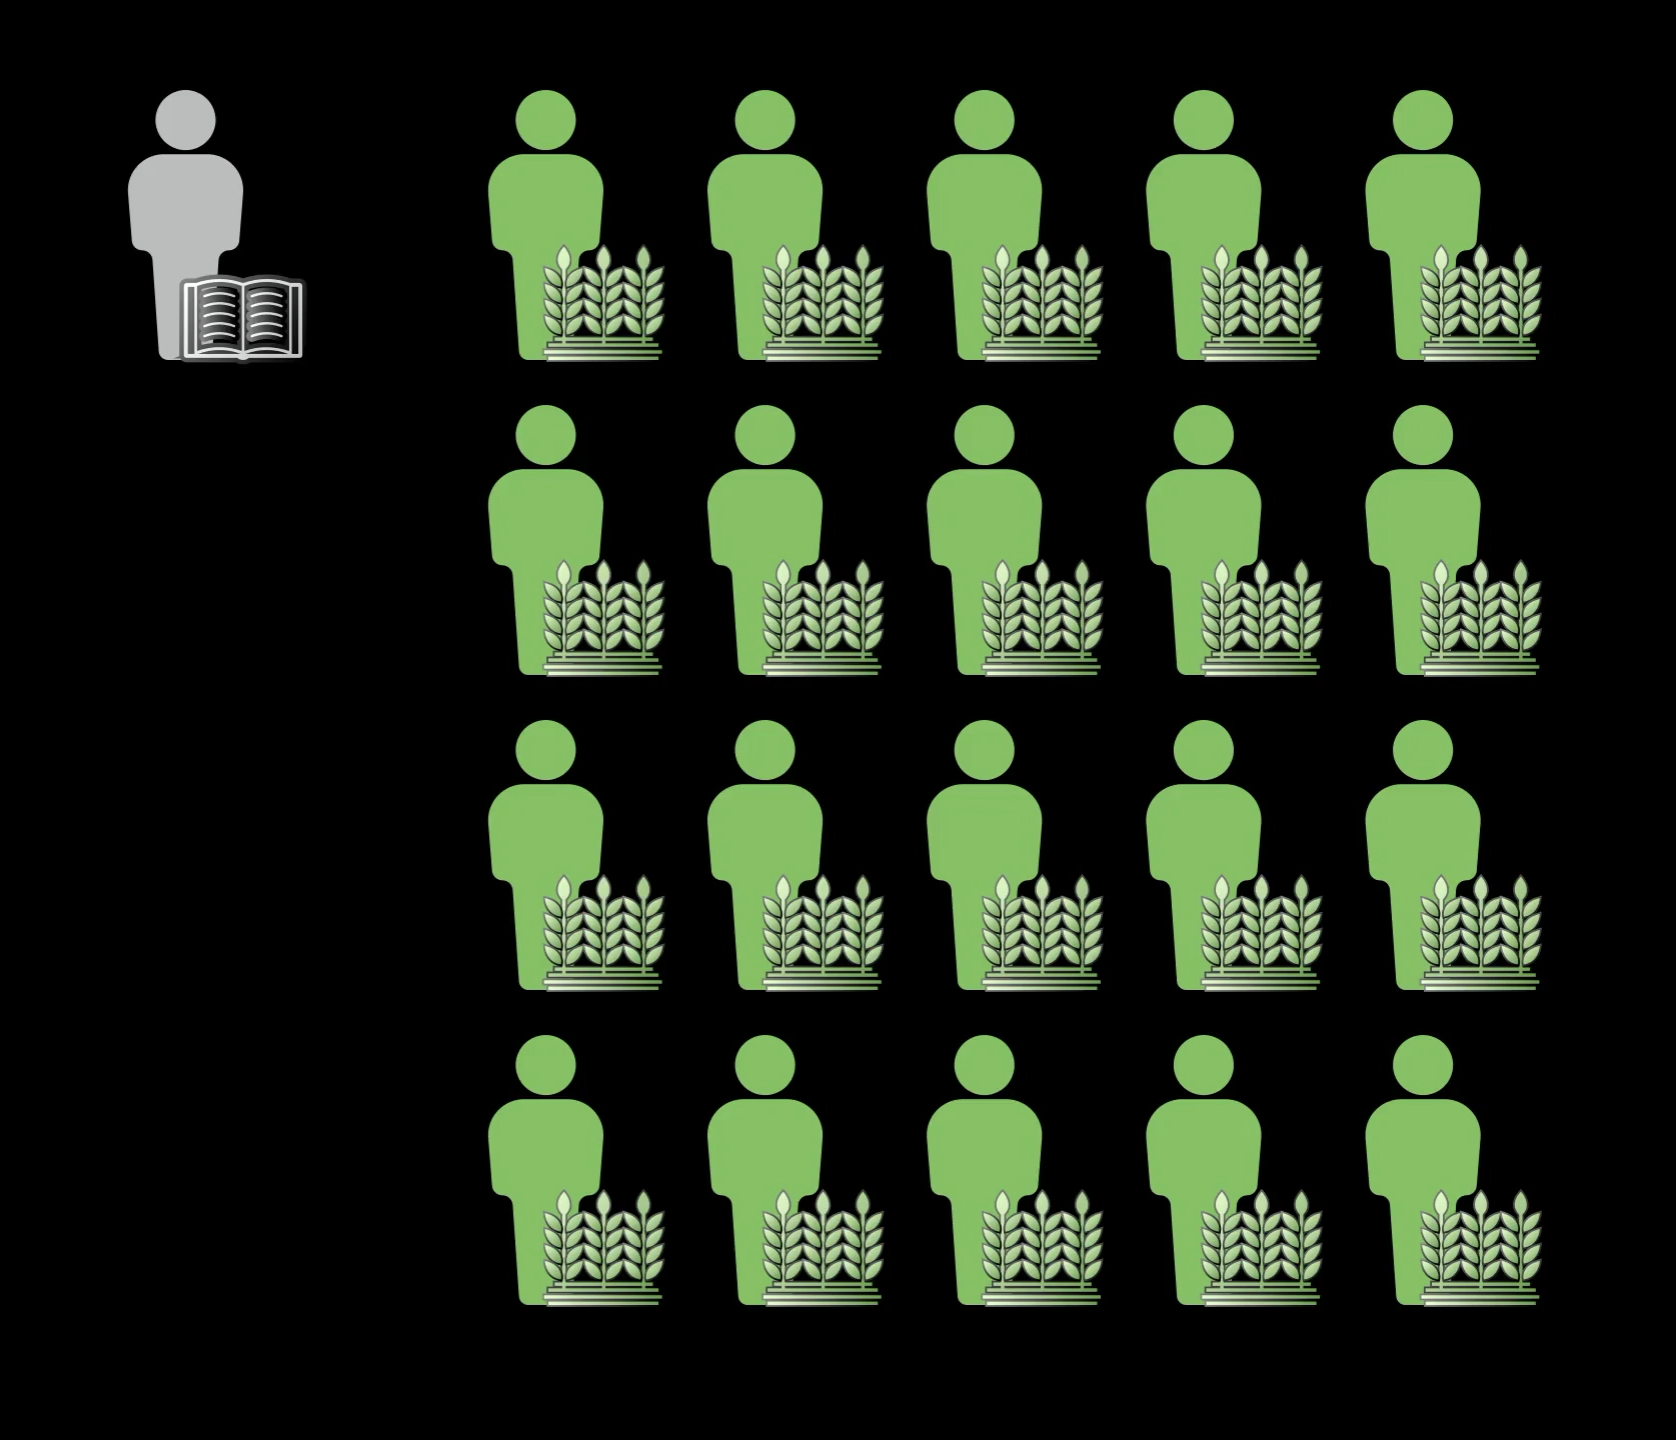
There are many more farmers than librarians.
This overwhelmingly large ratio of farmers to librarians greatly increases the chances that Steve is a farmer, even though his description seems librarian-ish.
To be clear, anyone who is asked this question is not expected to have perfect information on the actual statistics of farmers, librarians, and their personality traits. But the question is whether people even think to consider this ratio when deciding whether Steve is more likely a farmer or librarian.
After all, rationality is not about knowing facts. It’s about recognizing which facts are relevant.
Thinking about a sample
If you do think to make this estimate, there’s a simple way to reason about the question, which—spoiler alert—involves all the essential reasoning behind Bayes’ theorem.
You might start by picturing a representative sample of farmers and librarians. Say, 200 farmers and 10 librarians.
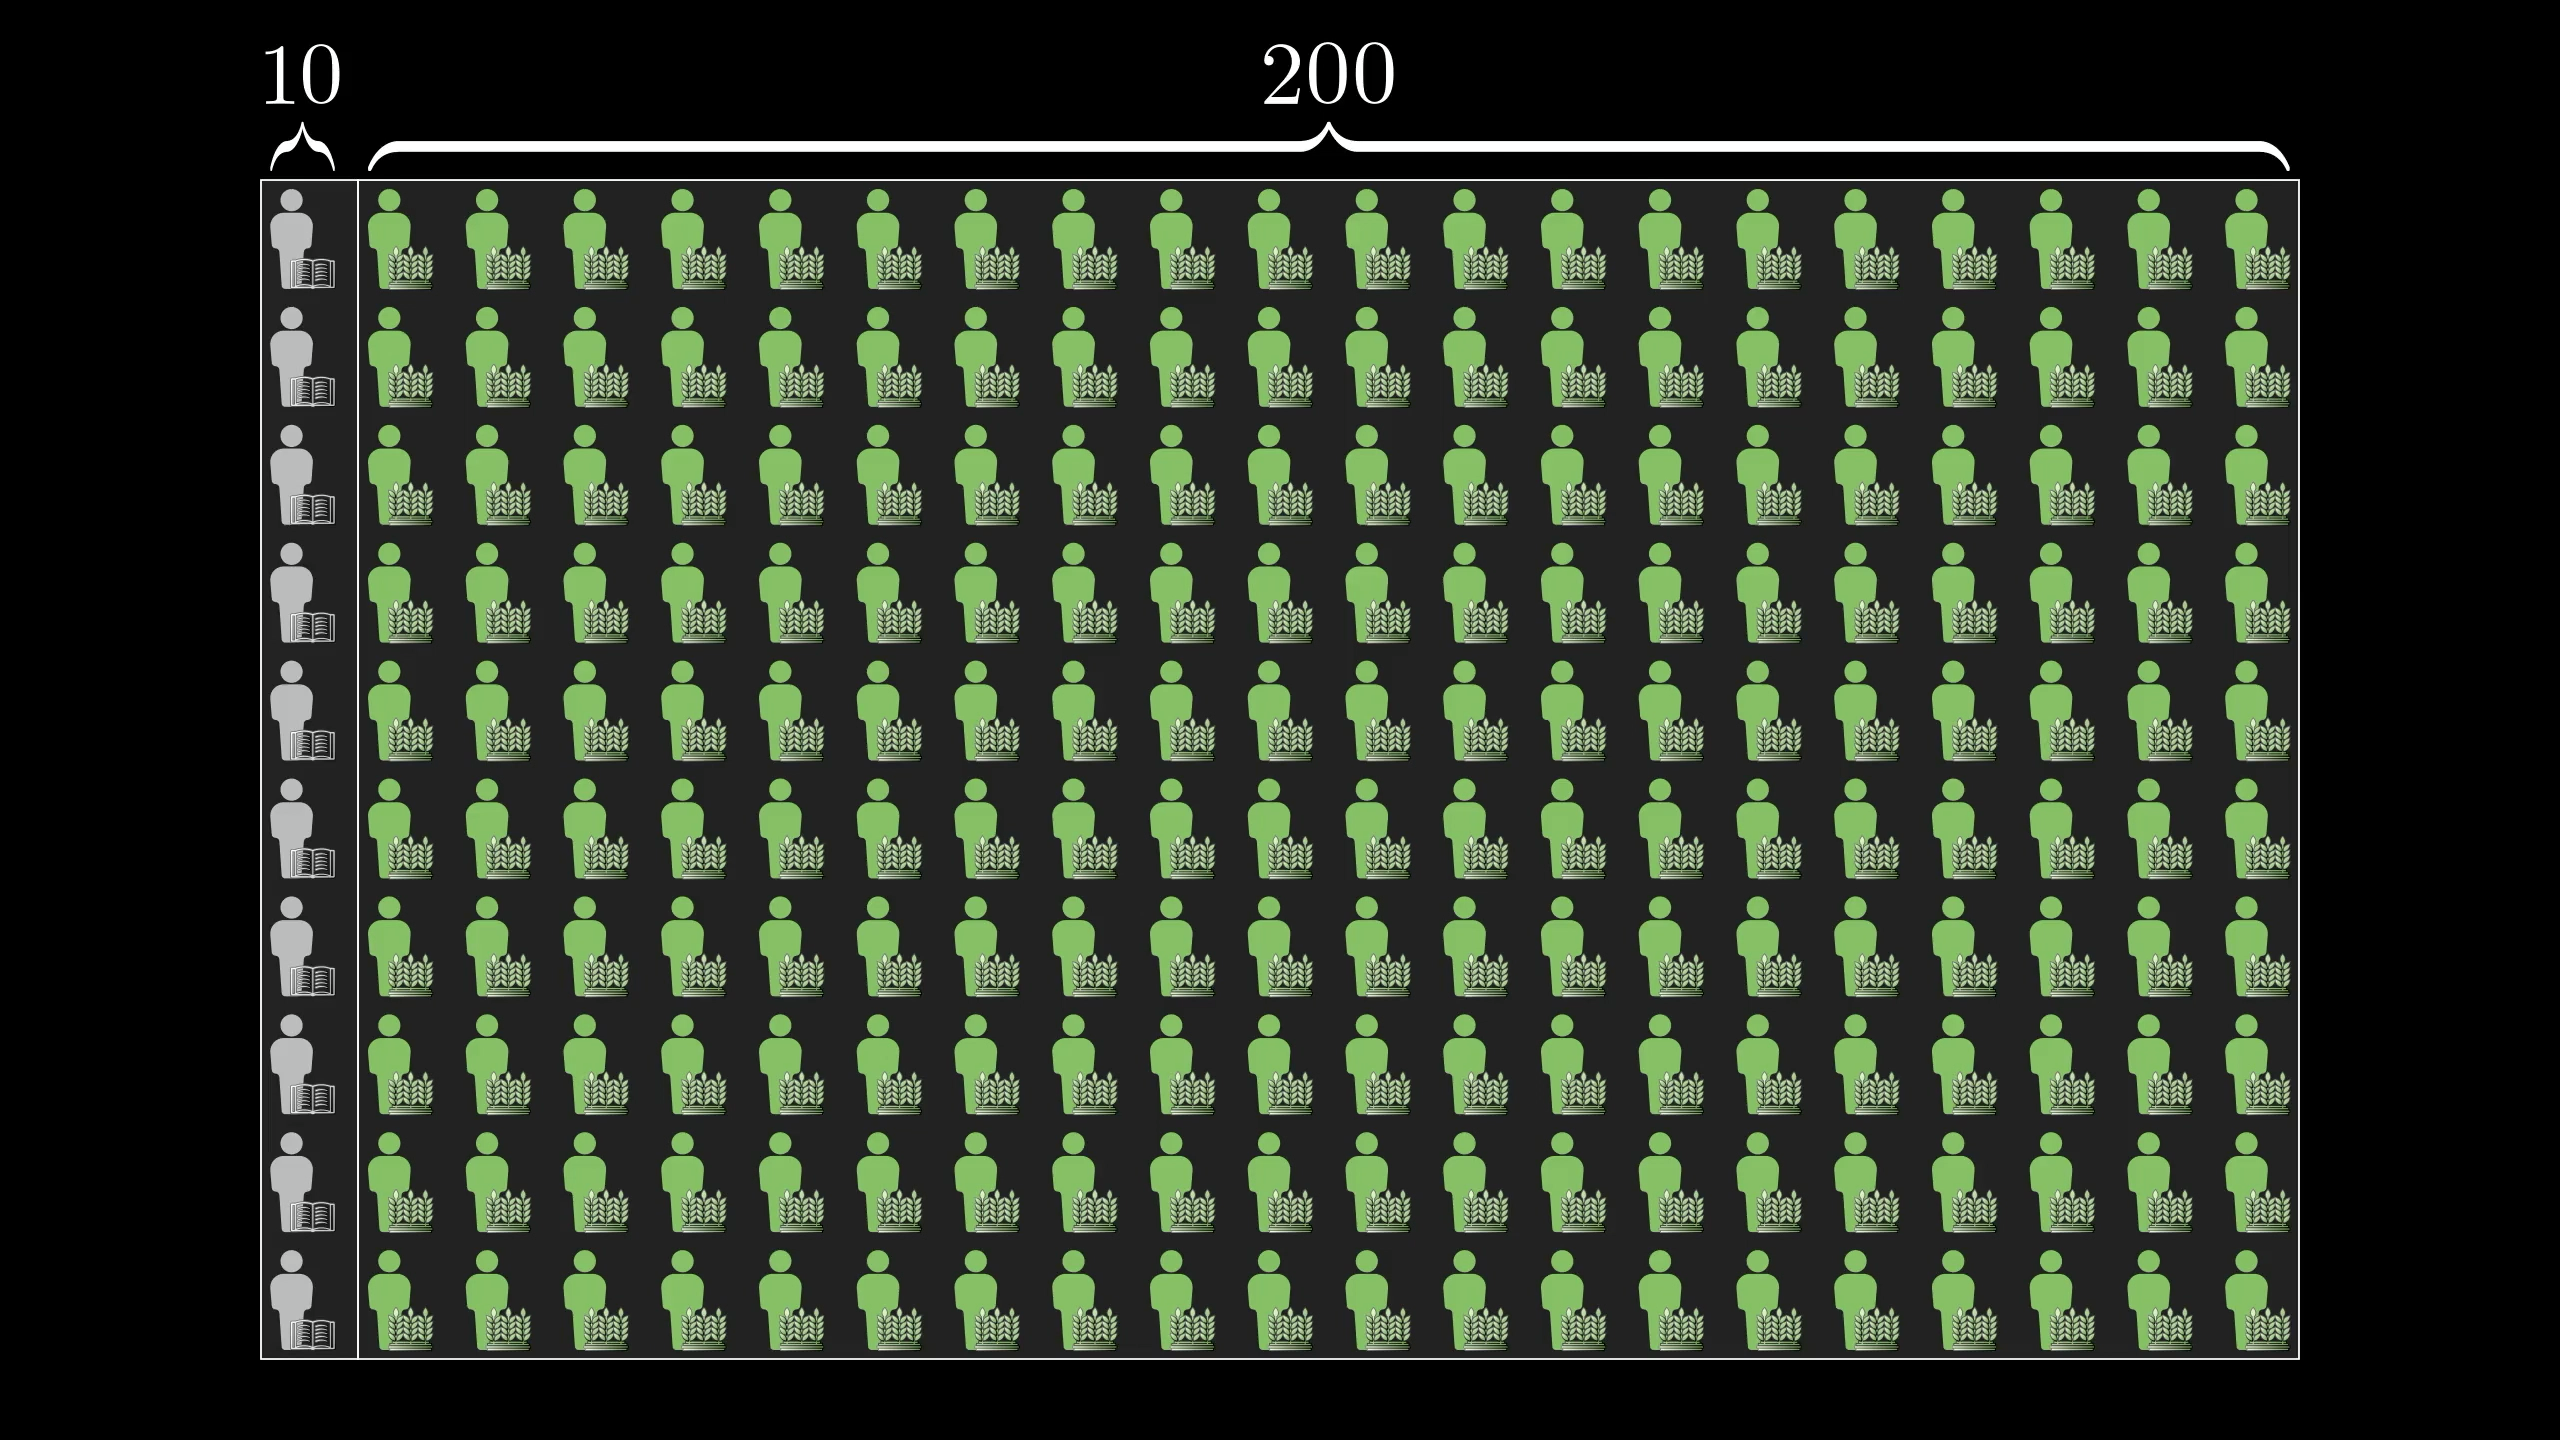
Then when you hear the meek and tidy soul description, let’s say your gut instinct is that 40% of librarians would fit that description and that 10% of farmers would.
Based on our sample of 210 farmers and librarians above, along with the percentages listed, how many librarians in our sample would you expect to fit Steve's description, and how many farmers?
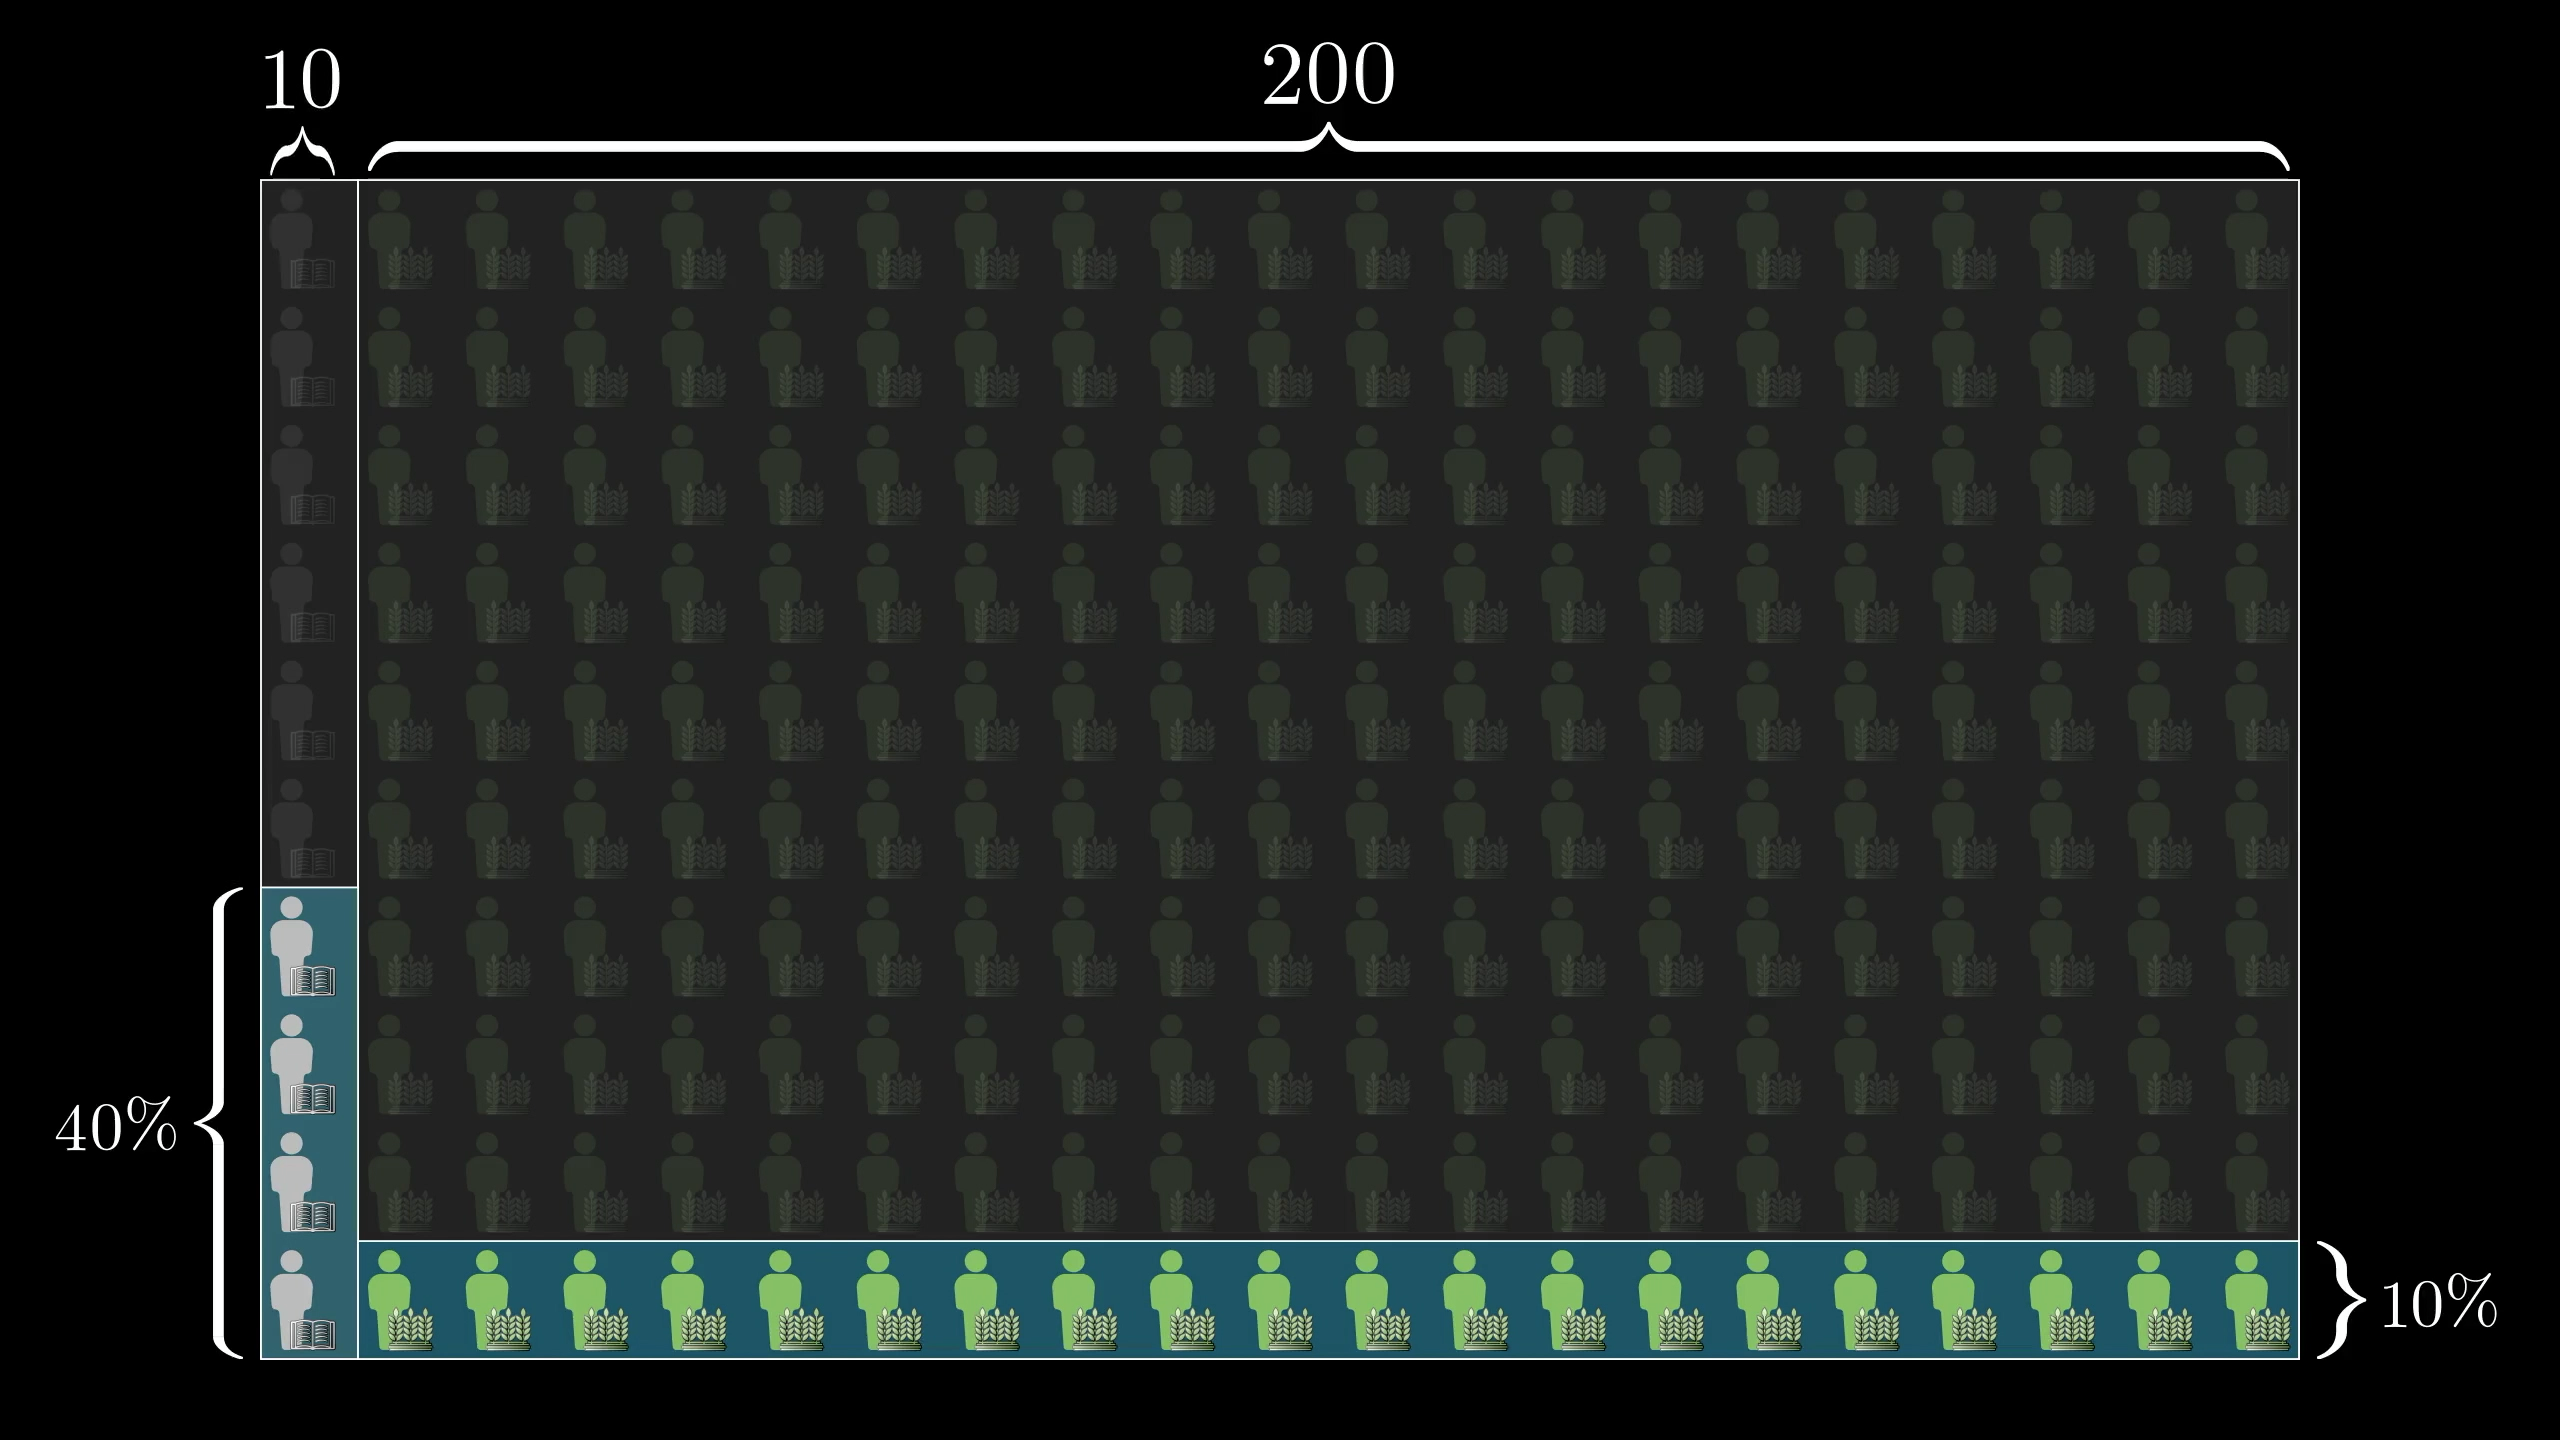
About 40% of librarians fit the description, but only 10% of farmers do. But that's still more farmers than librarians!
So the probability that a random person who fits this description is a librarian is , or 16.7%.
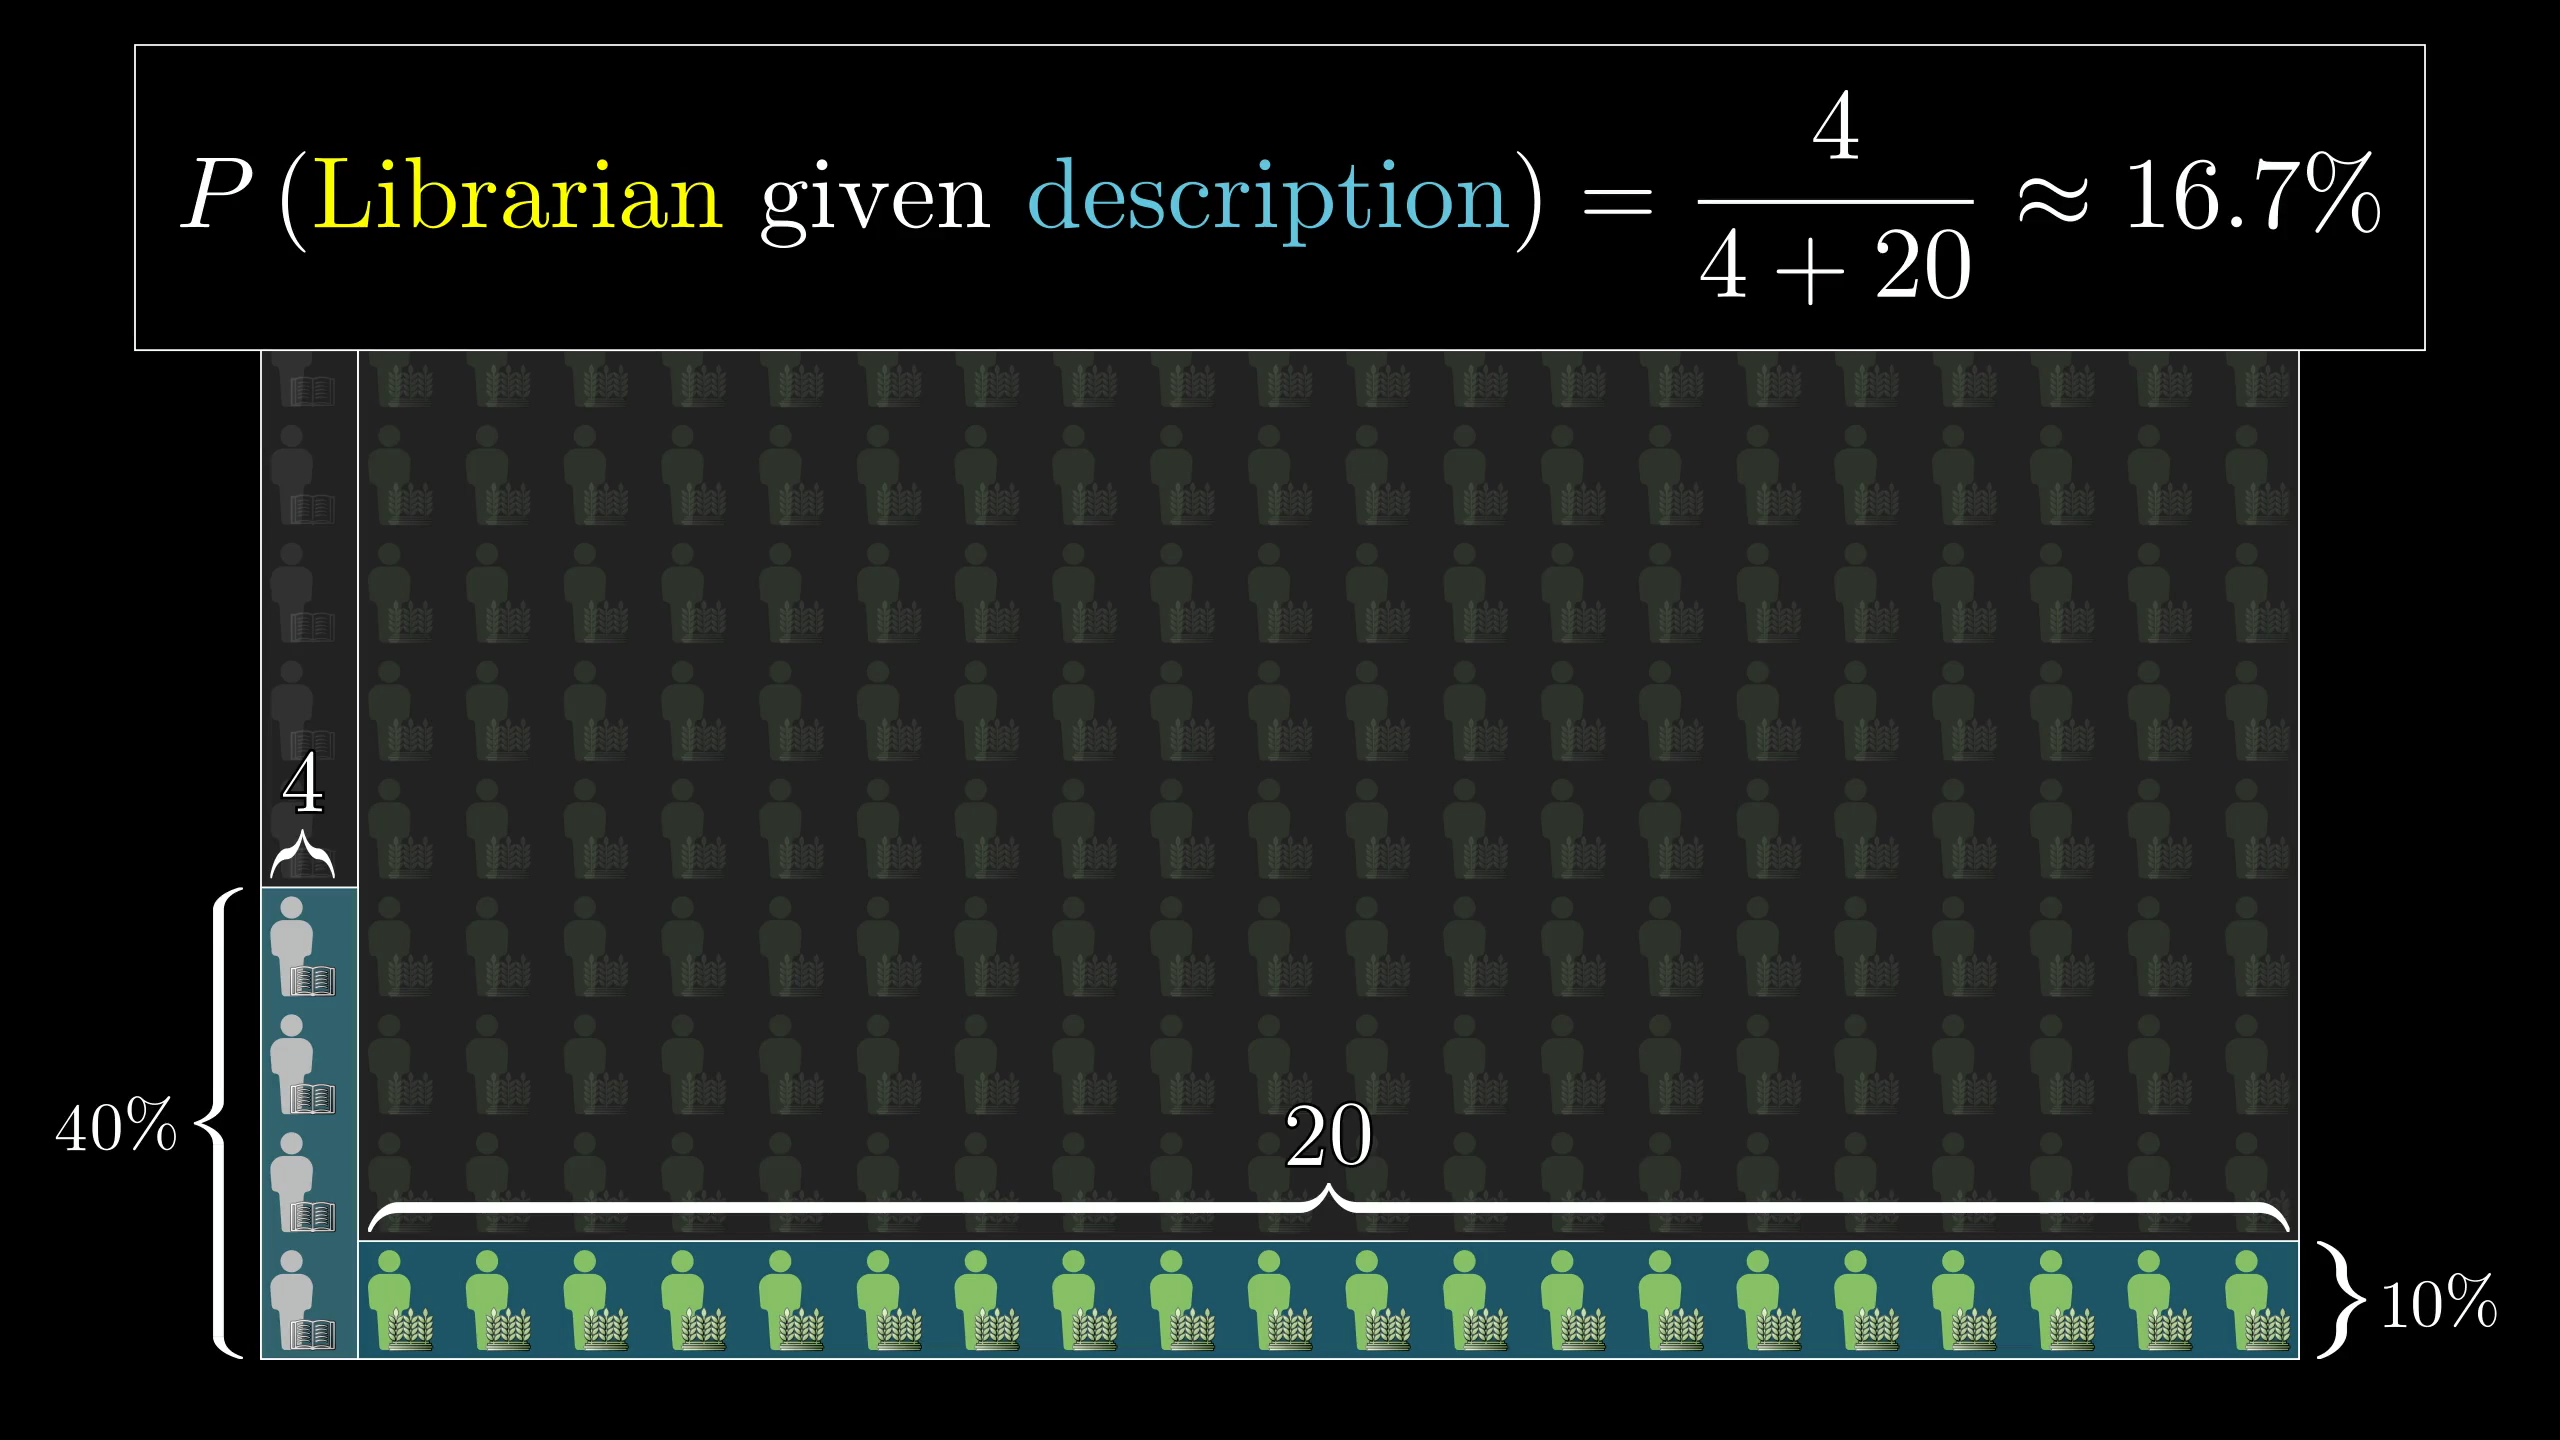
So even if you think a librarian is 4 times as likely as a farmer to fit this description, that’s not enough to overcome the fact that there are way more farmers. The upshot—and this is the key mantra underlying Bayes’ theorem—is that new evidence should not completely determine your beliefs in a vacuum; it should update prior beliefs.
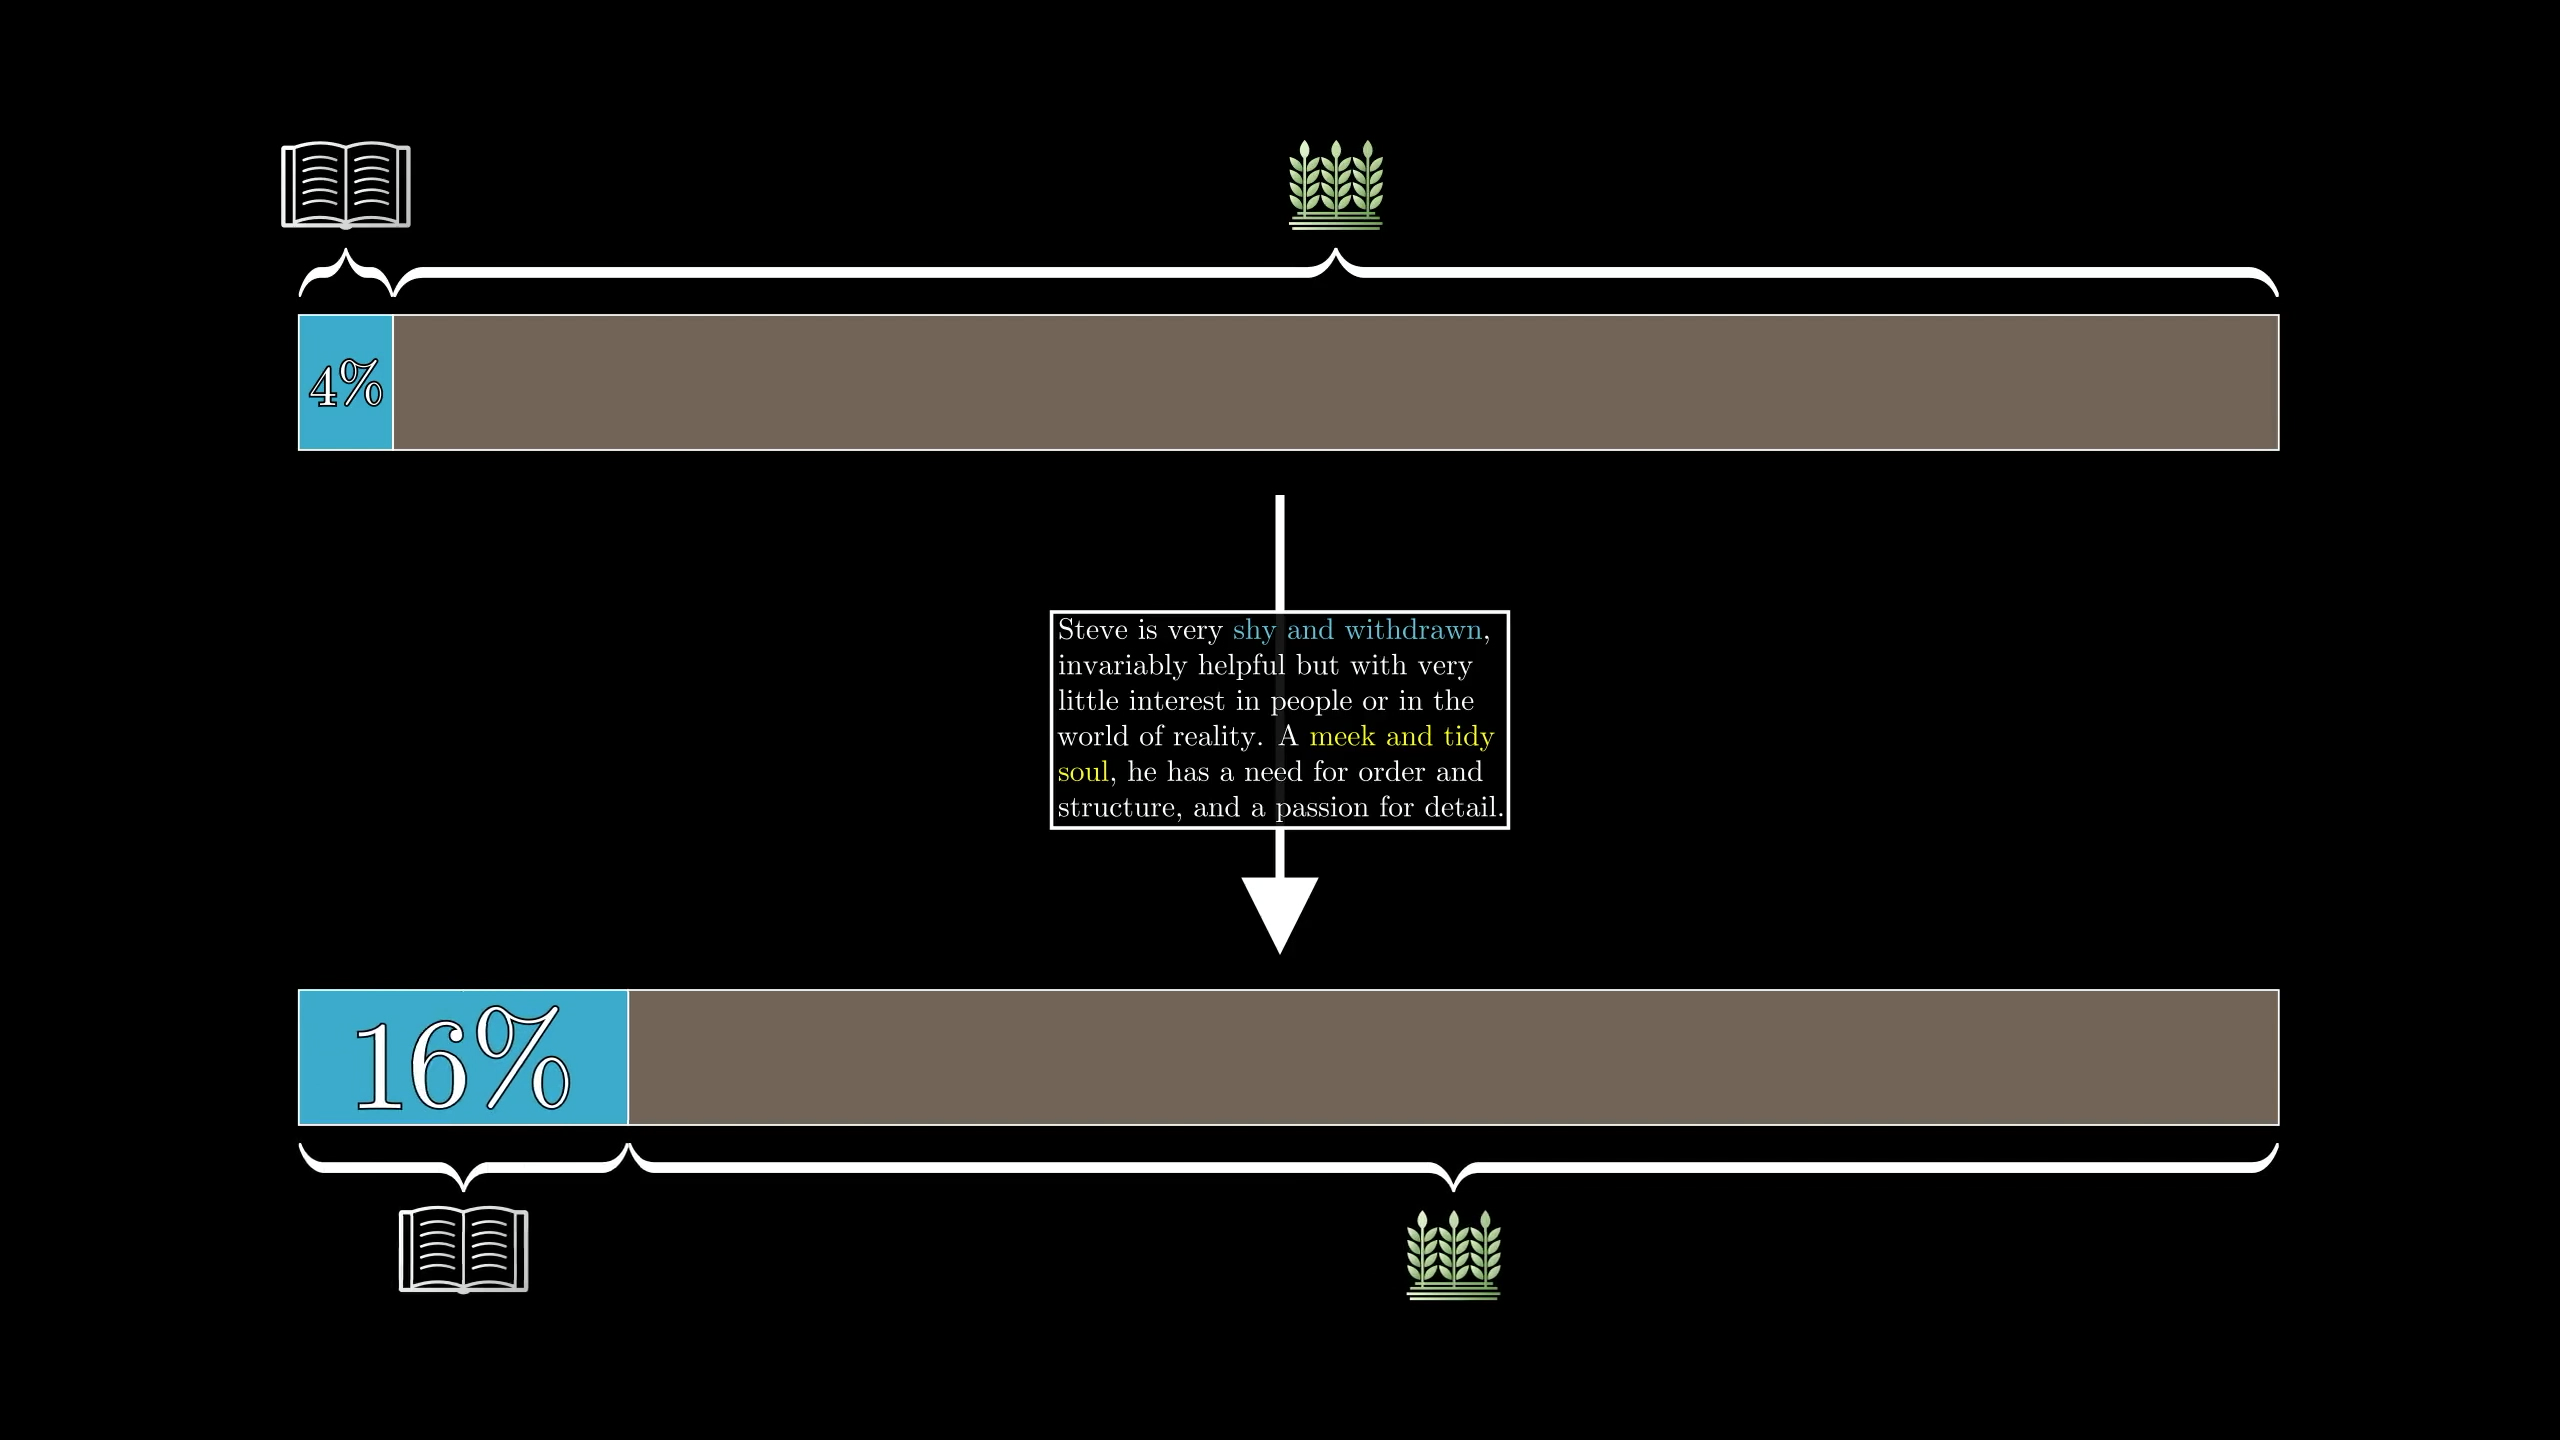
Before reading the description of Steve, there was about a 20-to-1 chance that he was a farmer rather than a librarian. Reading his description should update that belief, but not replace it entirely.
If this line of reasoning, where seeing new evidence restricts the space of possibilities, makes sense to you, then congratulations! You understand the heart of Bayes’ theorem.
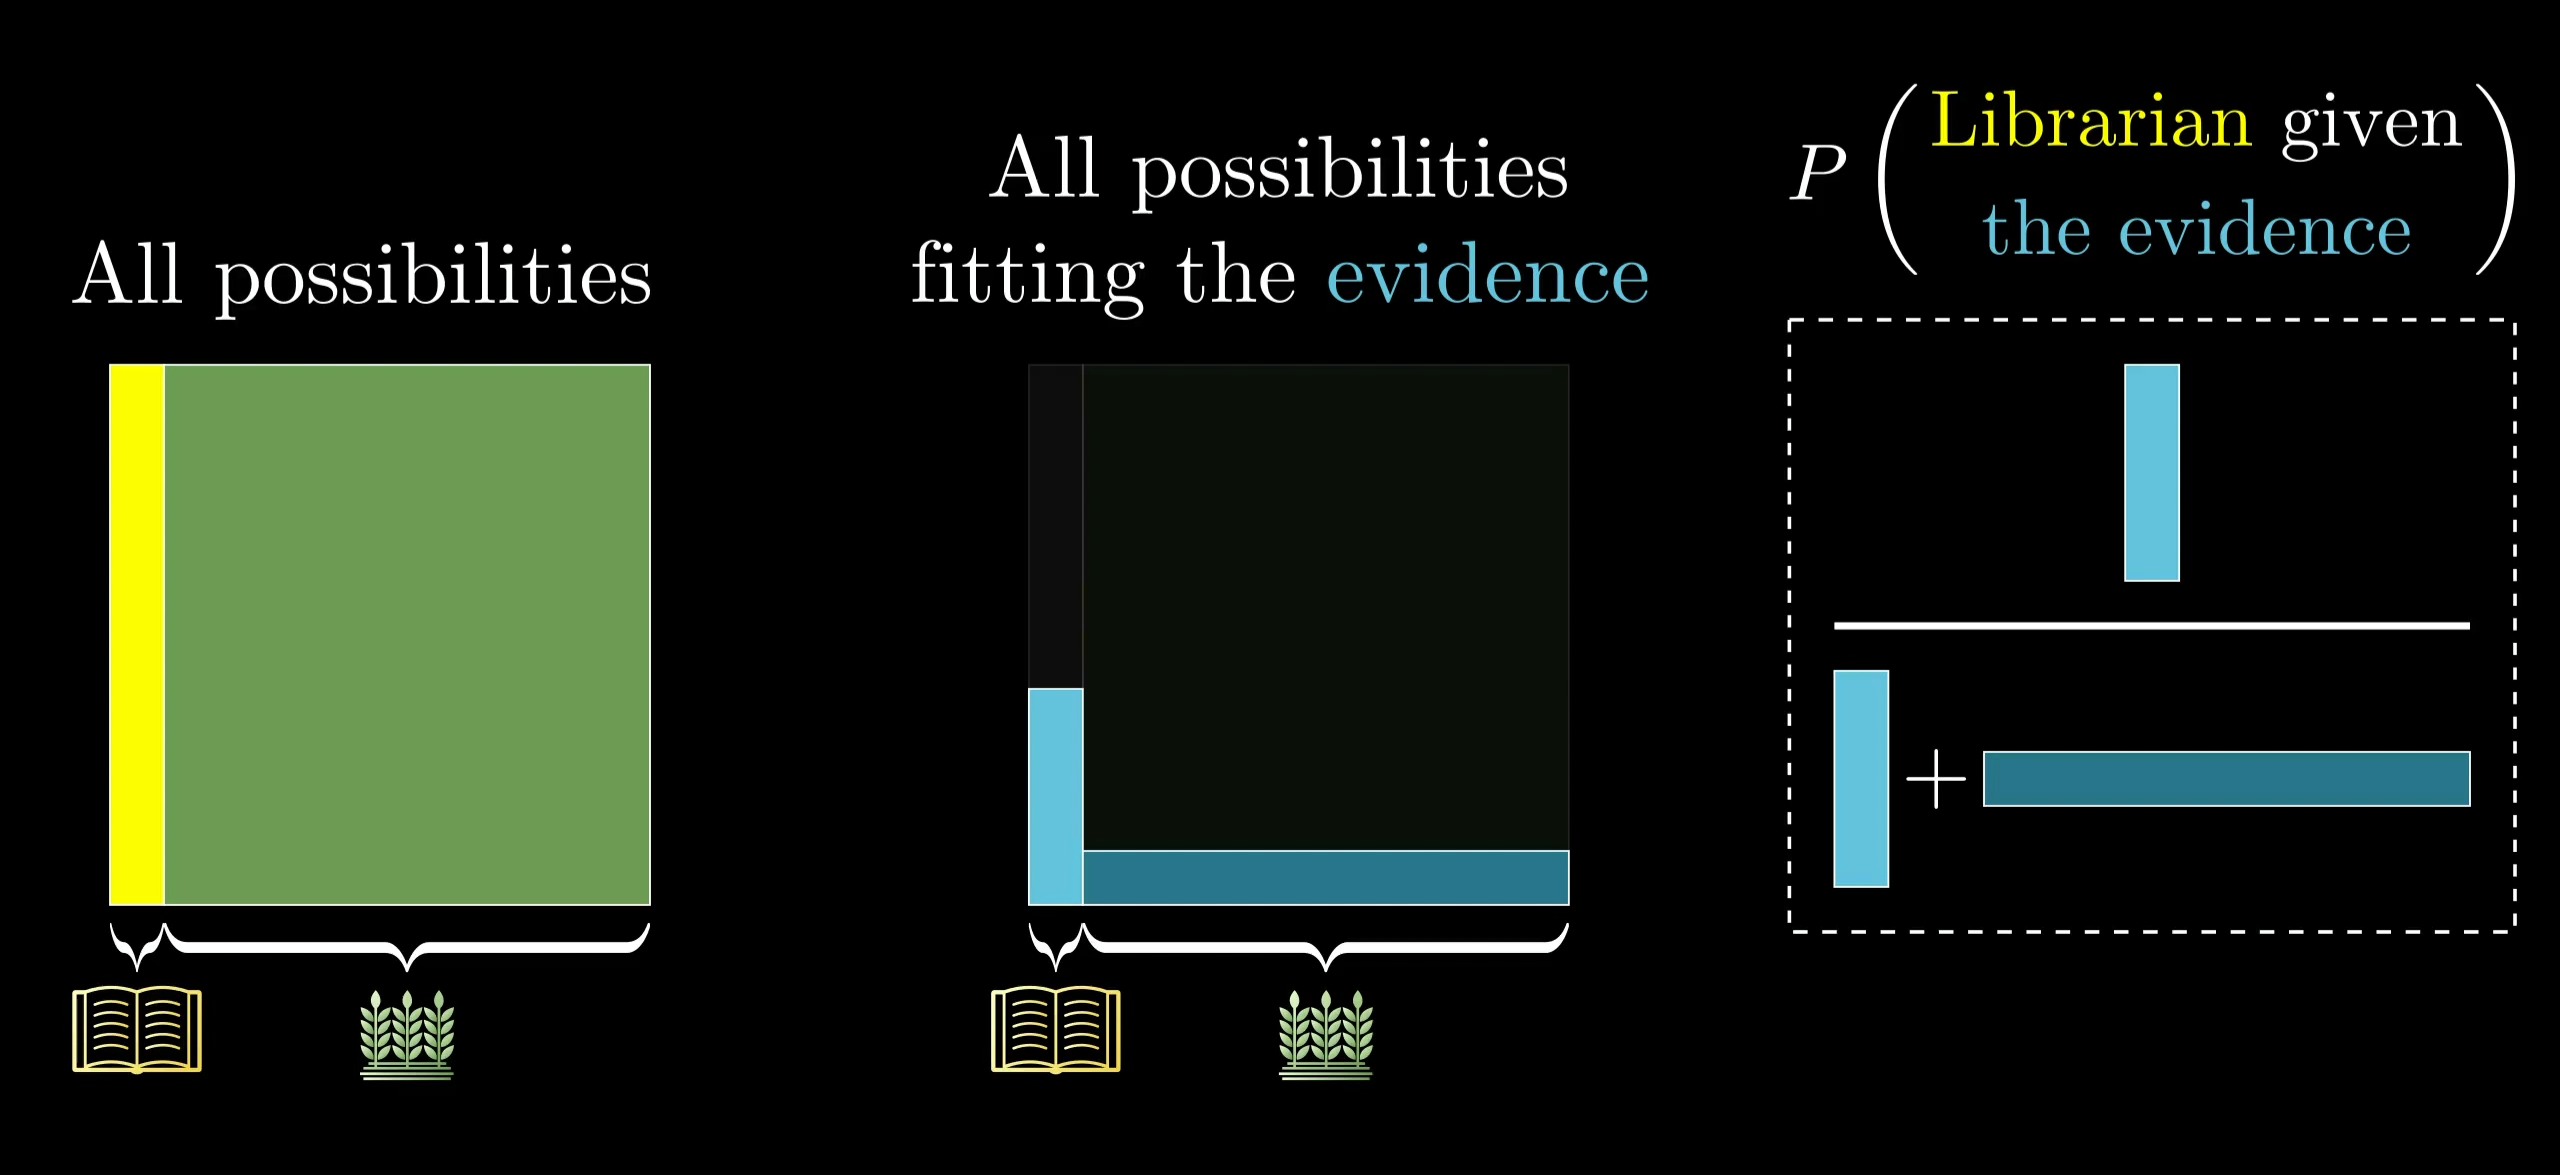
Maybe the numbers you’d estimate would be different, but what matters is how you fit the numbers together to update a belief based on evidence. That process of updating beliefs is what Bayes' theorem describes mathematically.
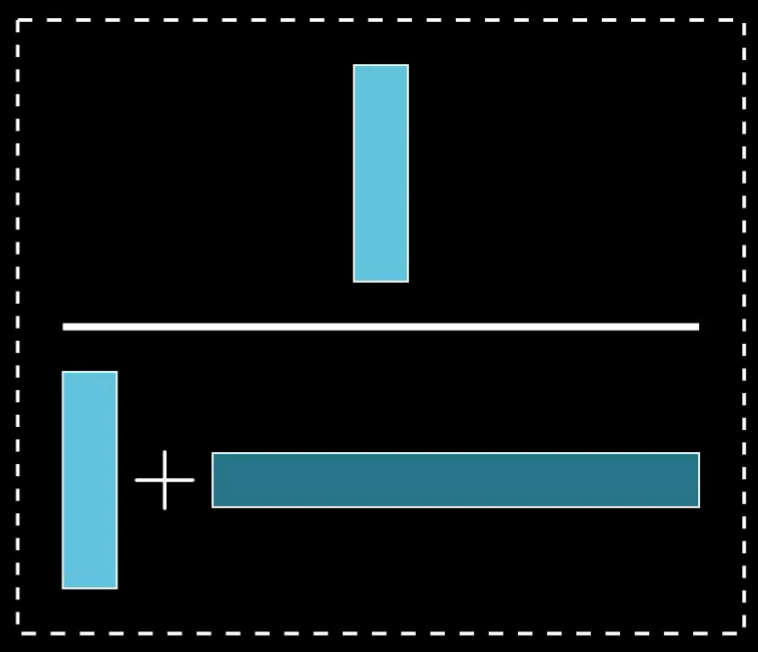
The heart of Bayes' theorem is this fraction.
Take a moment to think about how you might generalize what we just did, and write it down as a formula. The image above might serve as a helpful guide.
Building a formula
Bayes’ theorem is relevant in situations where you have some hypothesis (Steve is a librarian), and you see some evidence (Steve is a "meek and tidy soul"), and you want to know the probability that the hypothesis holds given that the evidence is true.
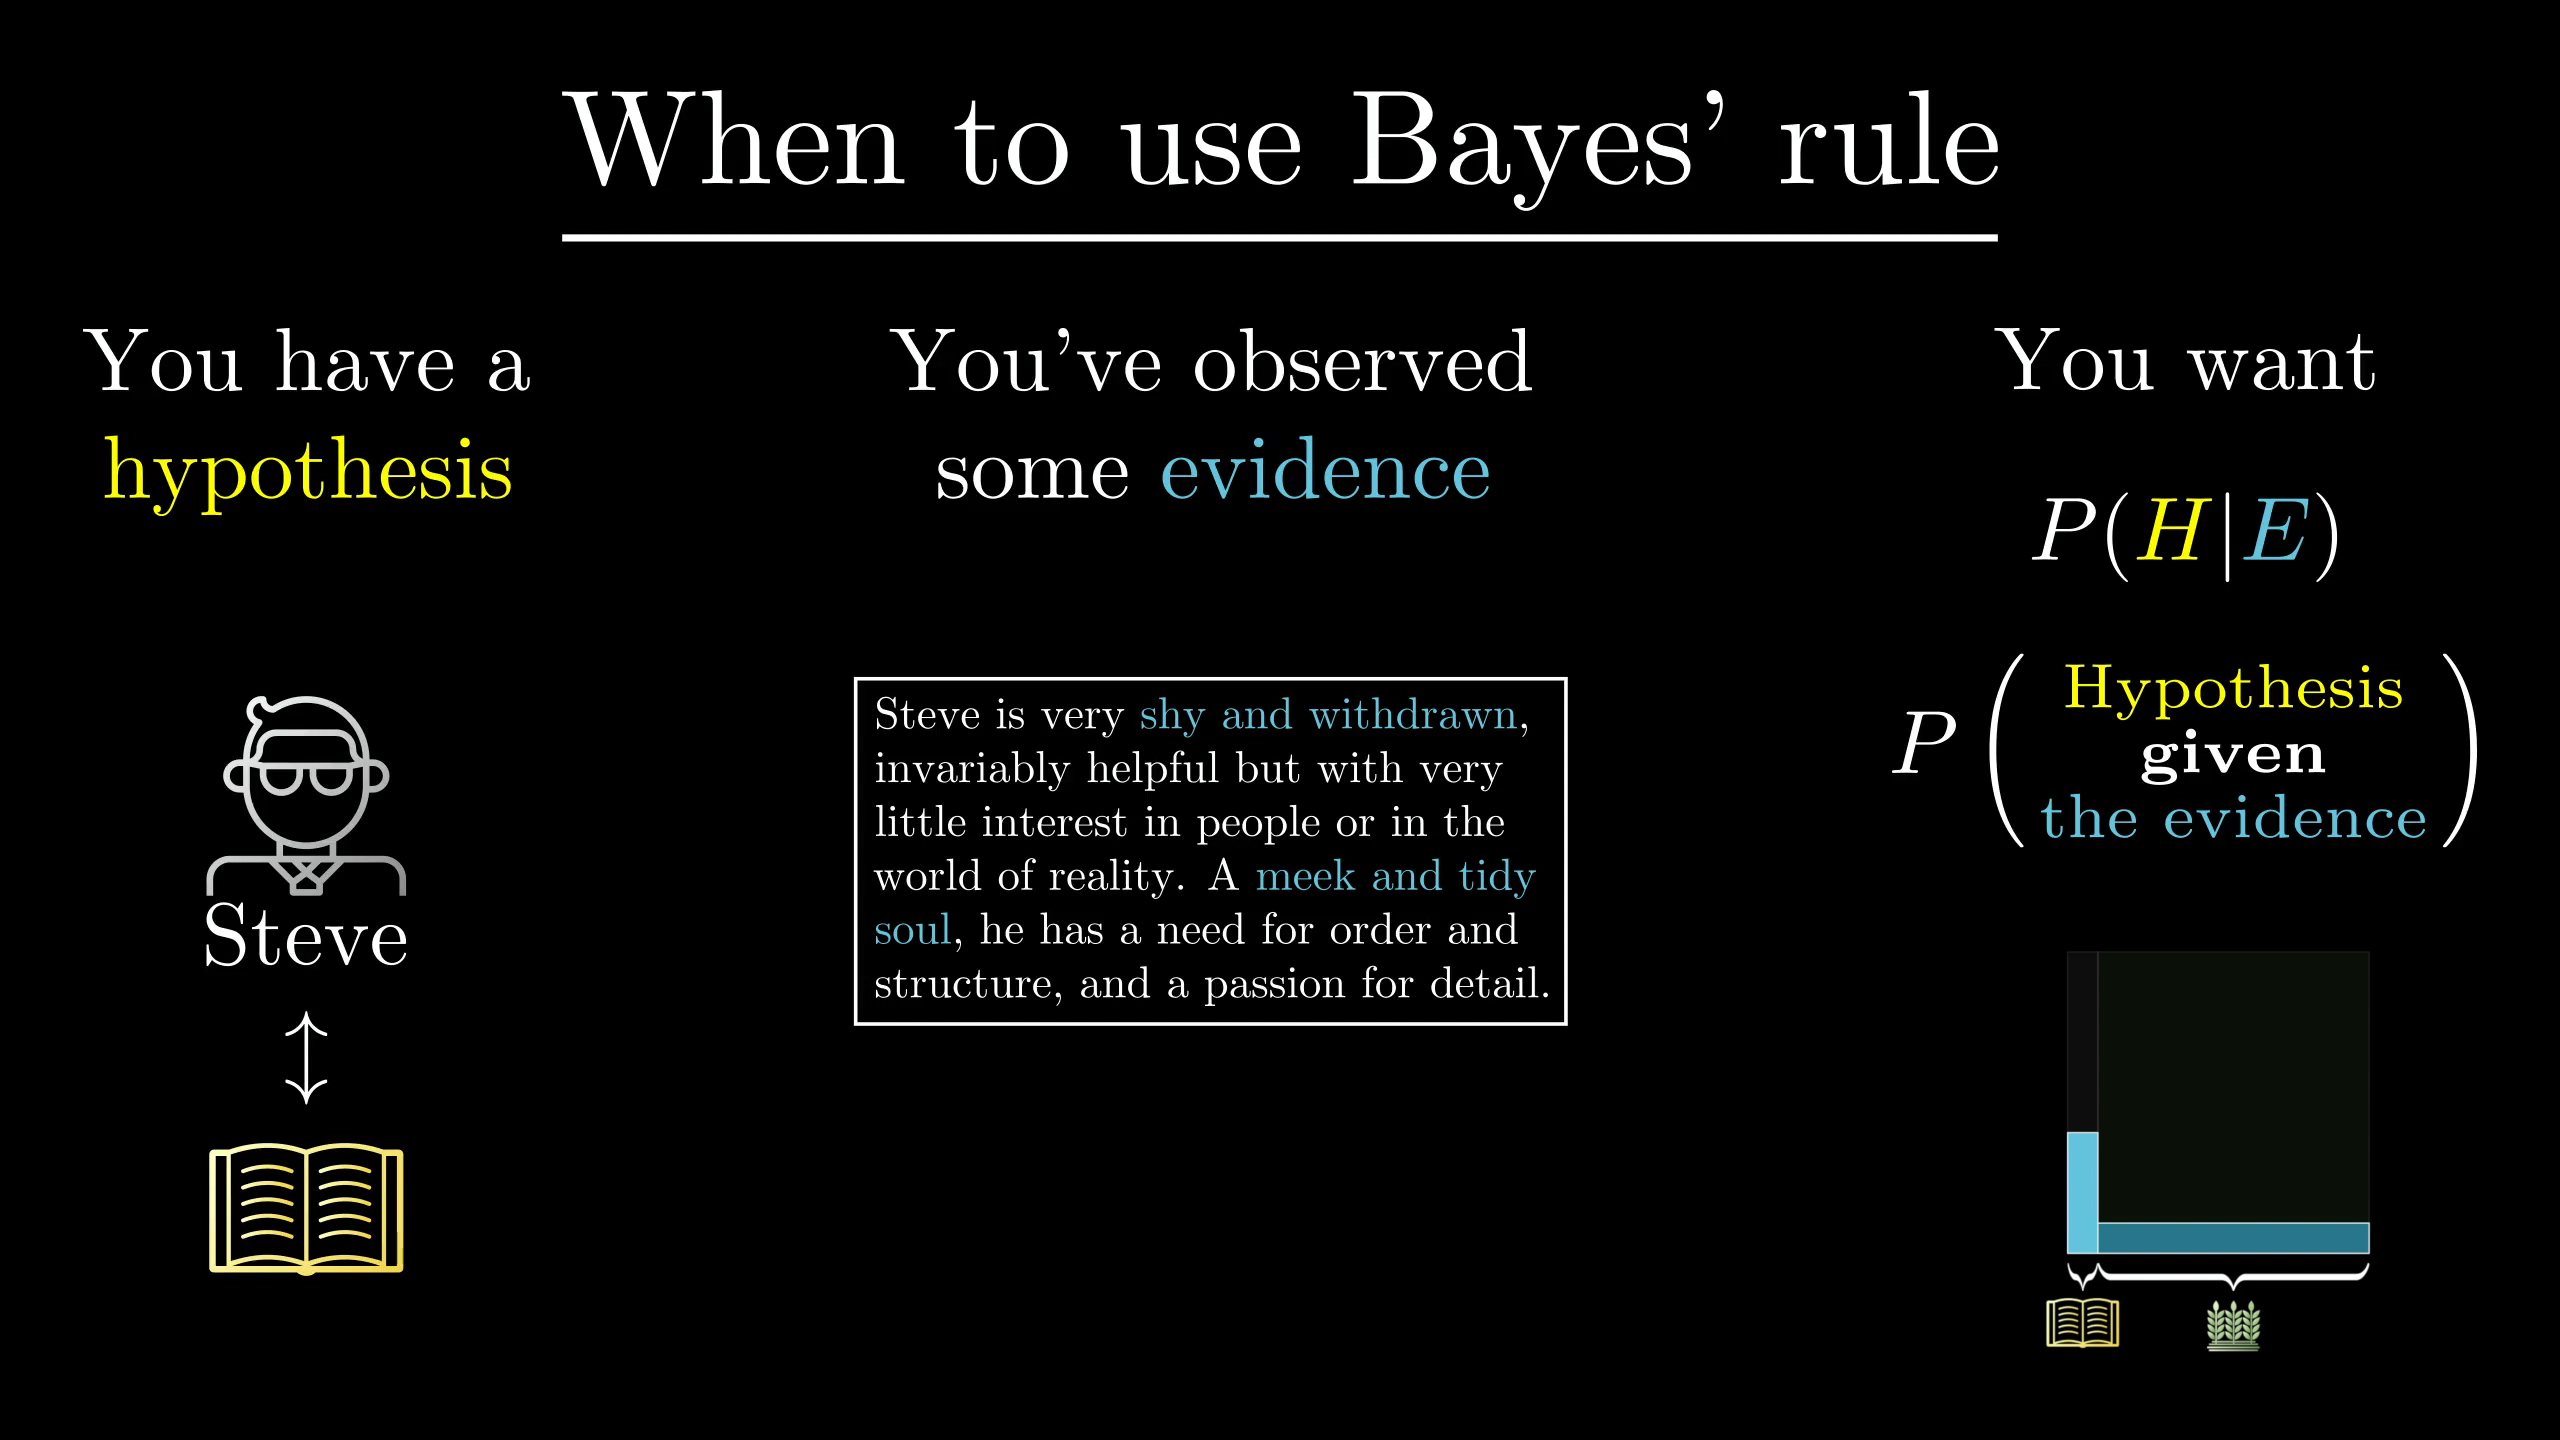
In the standard notation, this vertical bar means “given that”. As in, we’re restricting our view only to the possibilities where the evidence holds.

The first relevant number is the probability that the hypothesis holds before considering the new evidence. In our example, that was , which came from considering the ratio of farmers to librarians in the general population. This is known as the "prior".
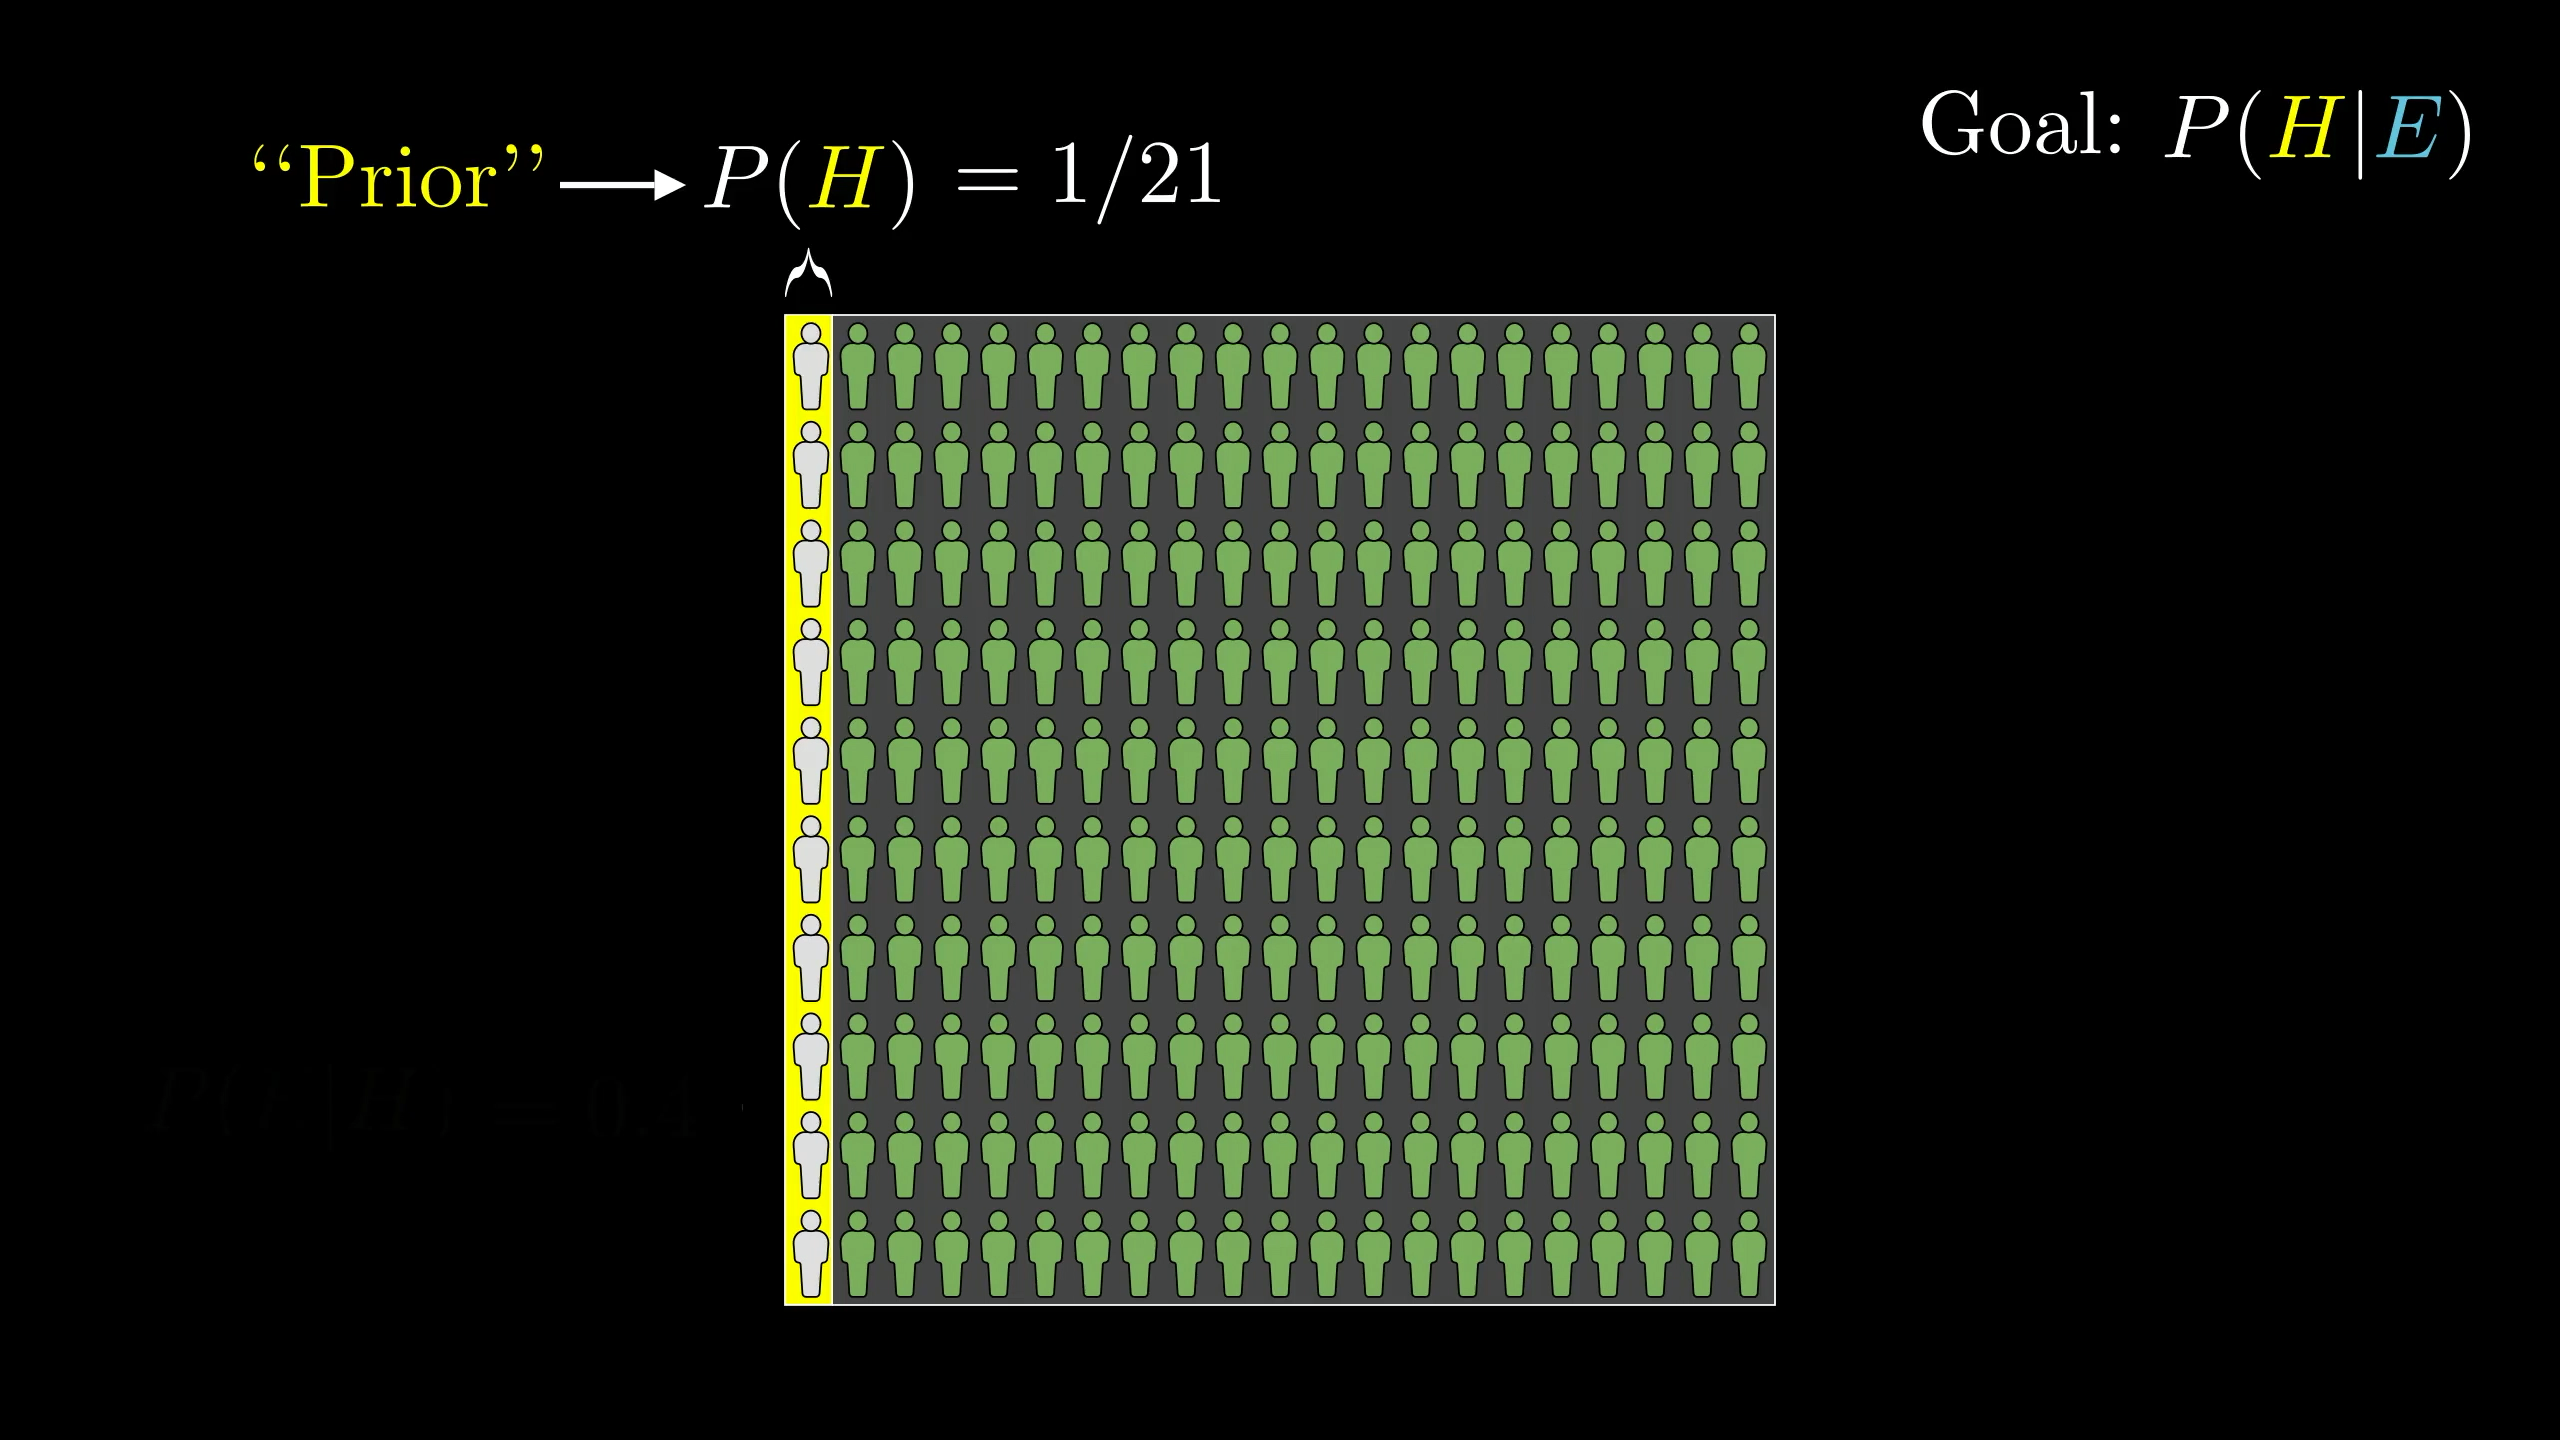
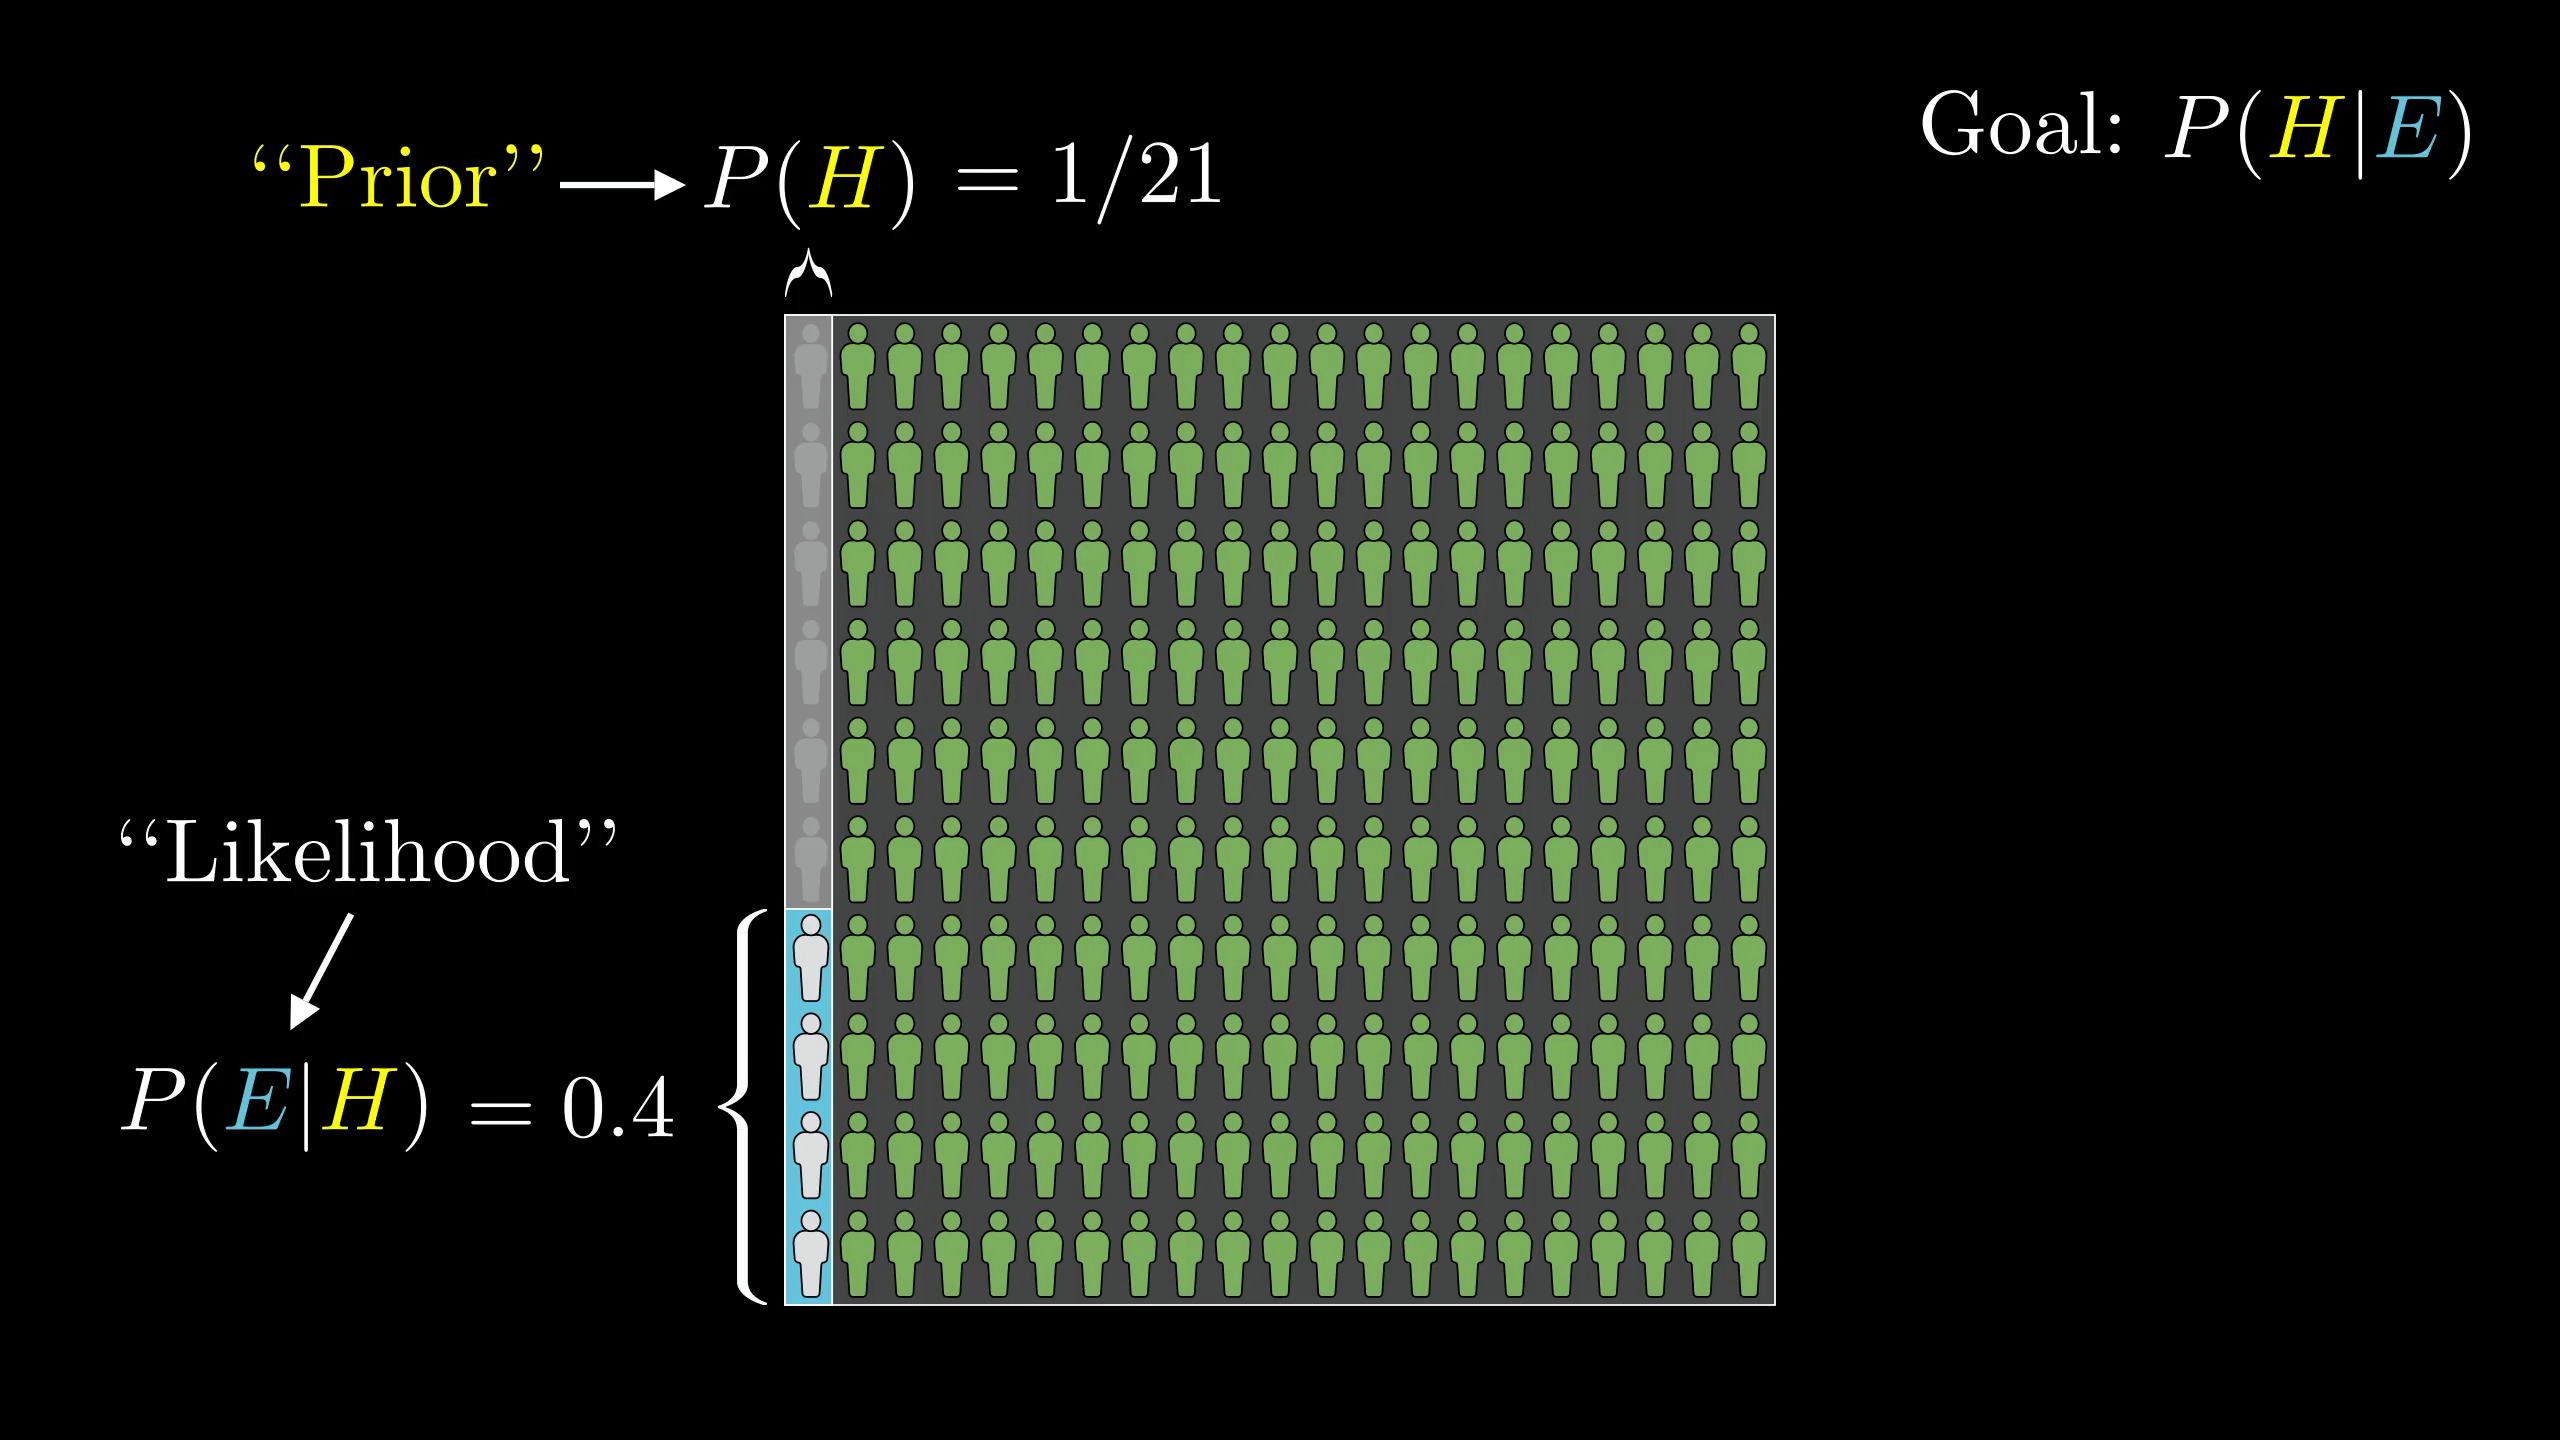
After that, we needed to consider the proportion of librarians that fit this description.
That proportion is the probability that we would see the evidence, given that the hypothesis is true. That is, . Again, when you see this vertical bar, it means we’re talking about a proportion of a limited part of the total space of possibilities. In this case, limited to the left side where the hypothesis holds.
In the context of Bayes’ theorem, this value also has a special name. It’s called the “likelihood”.
Similarly, we need to know how much of the other side of our space includes the evidence. That's the probability of seeing the evidence given that our hypothesis isn’t true. (In our case, the probability of a non-librarian matching Steve's description.)
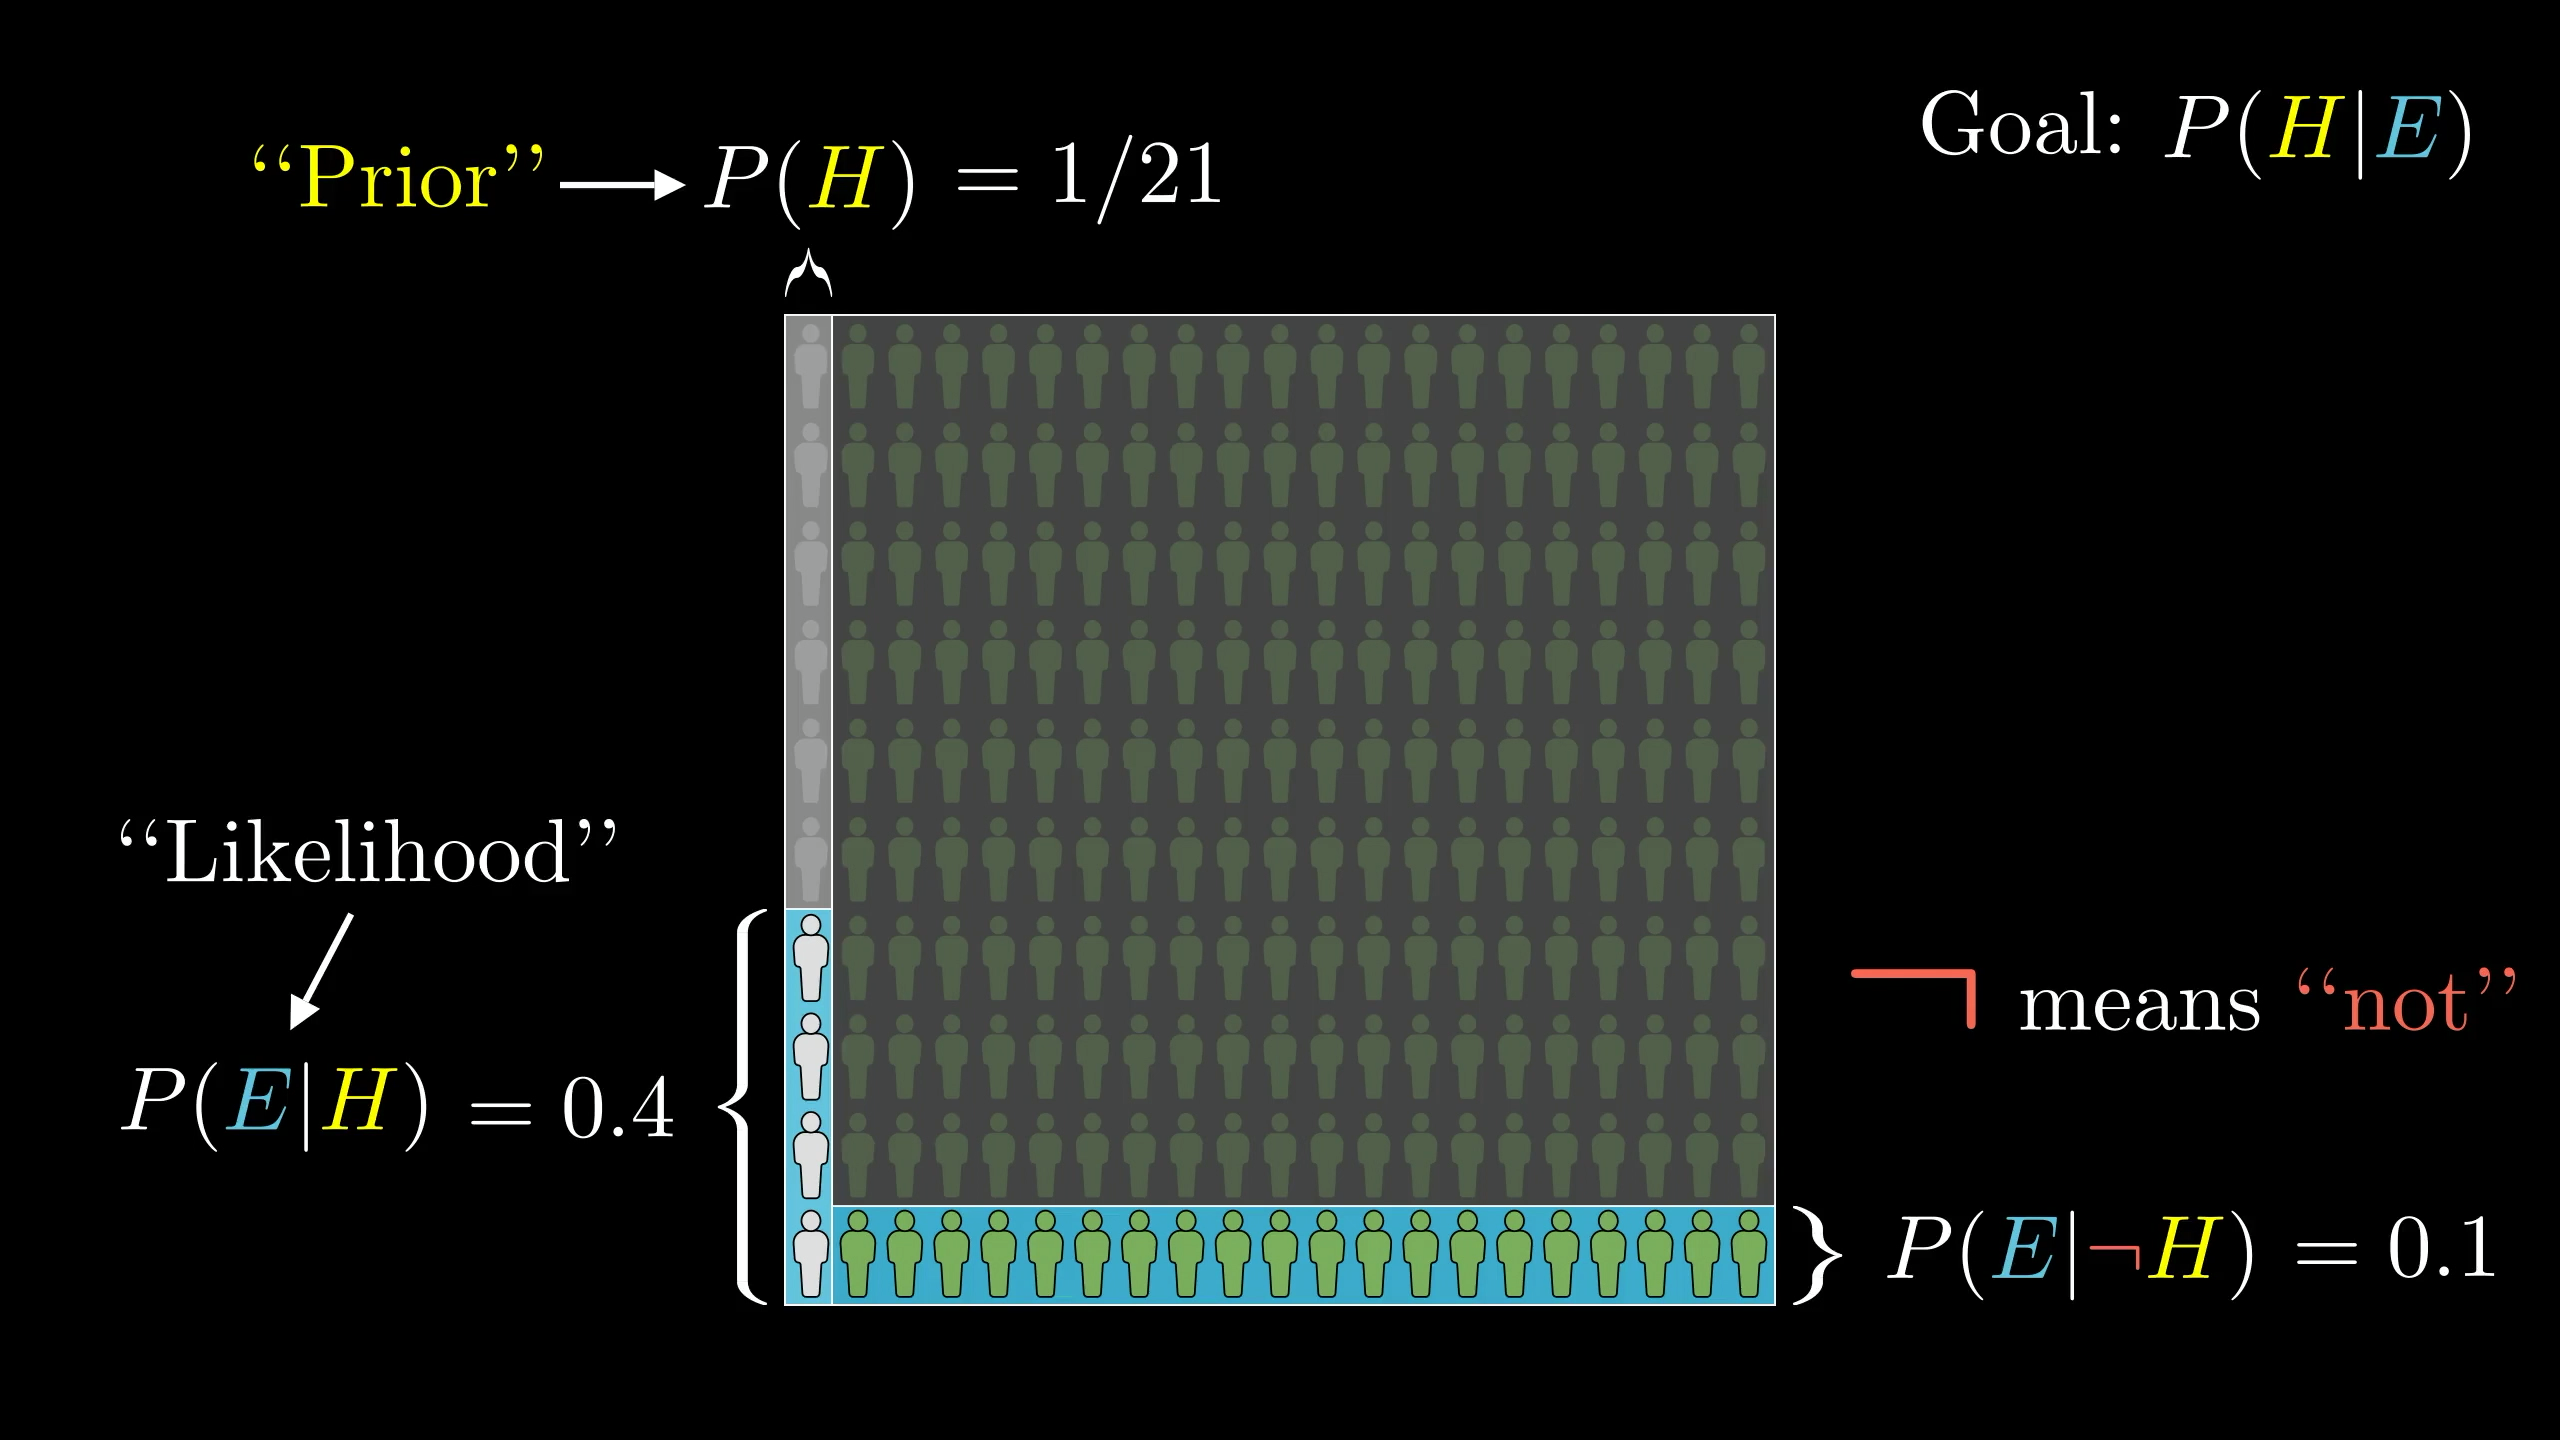
Finally, we calculate , the probability of seeing the evidence given that the hypothesis is false.
Now remember what our final answer was.
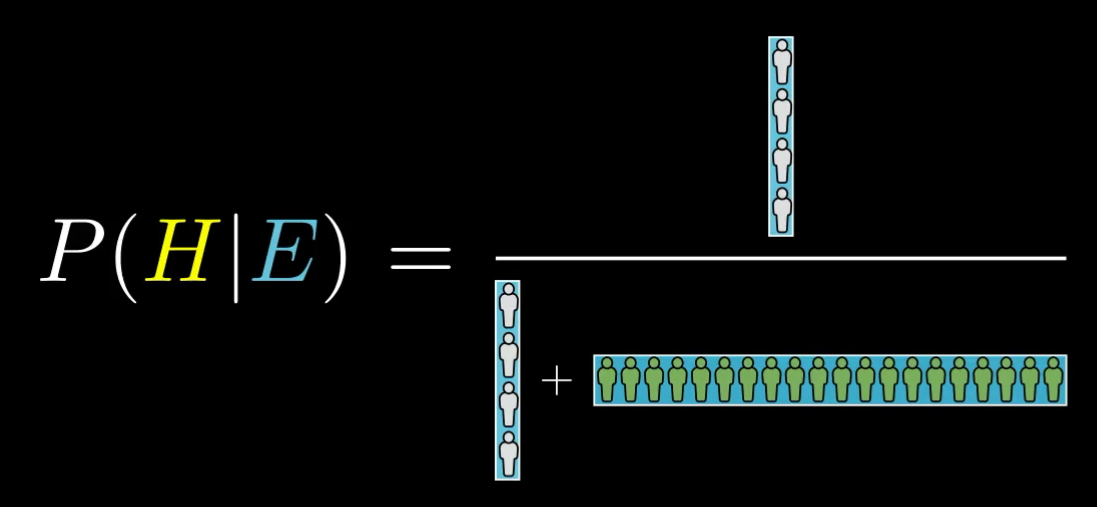
The probability that our librarian hypothesis is true given the evidence is the total number of librarians fitting the evidence, 4, divided by the total number of people fitting the evidence, 24.
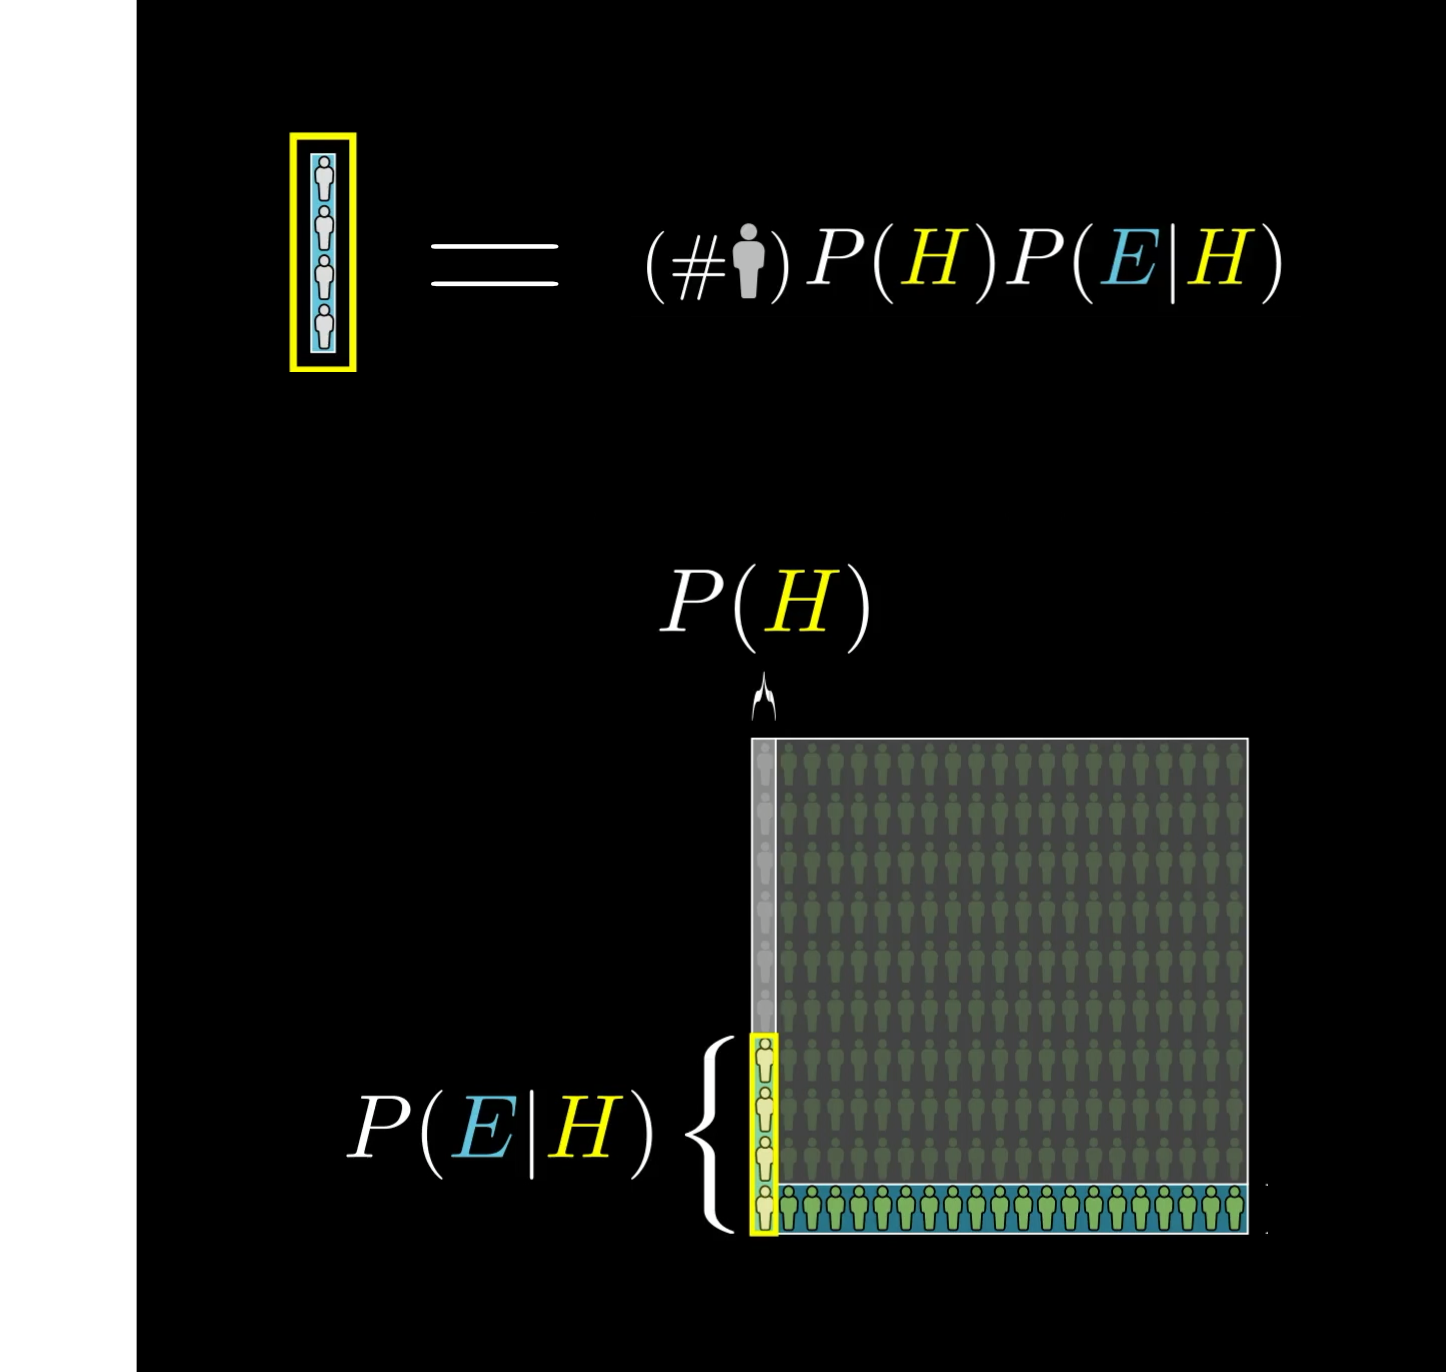
Where does that 4 come from? Well it’s the total number of people, times the prior probability of being a librarian, giving us the 10 total librarians, times the probability that one of those fits the evidence.
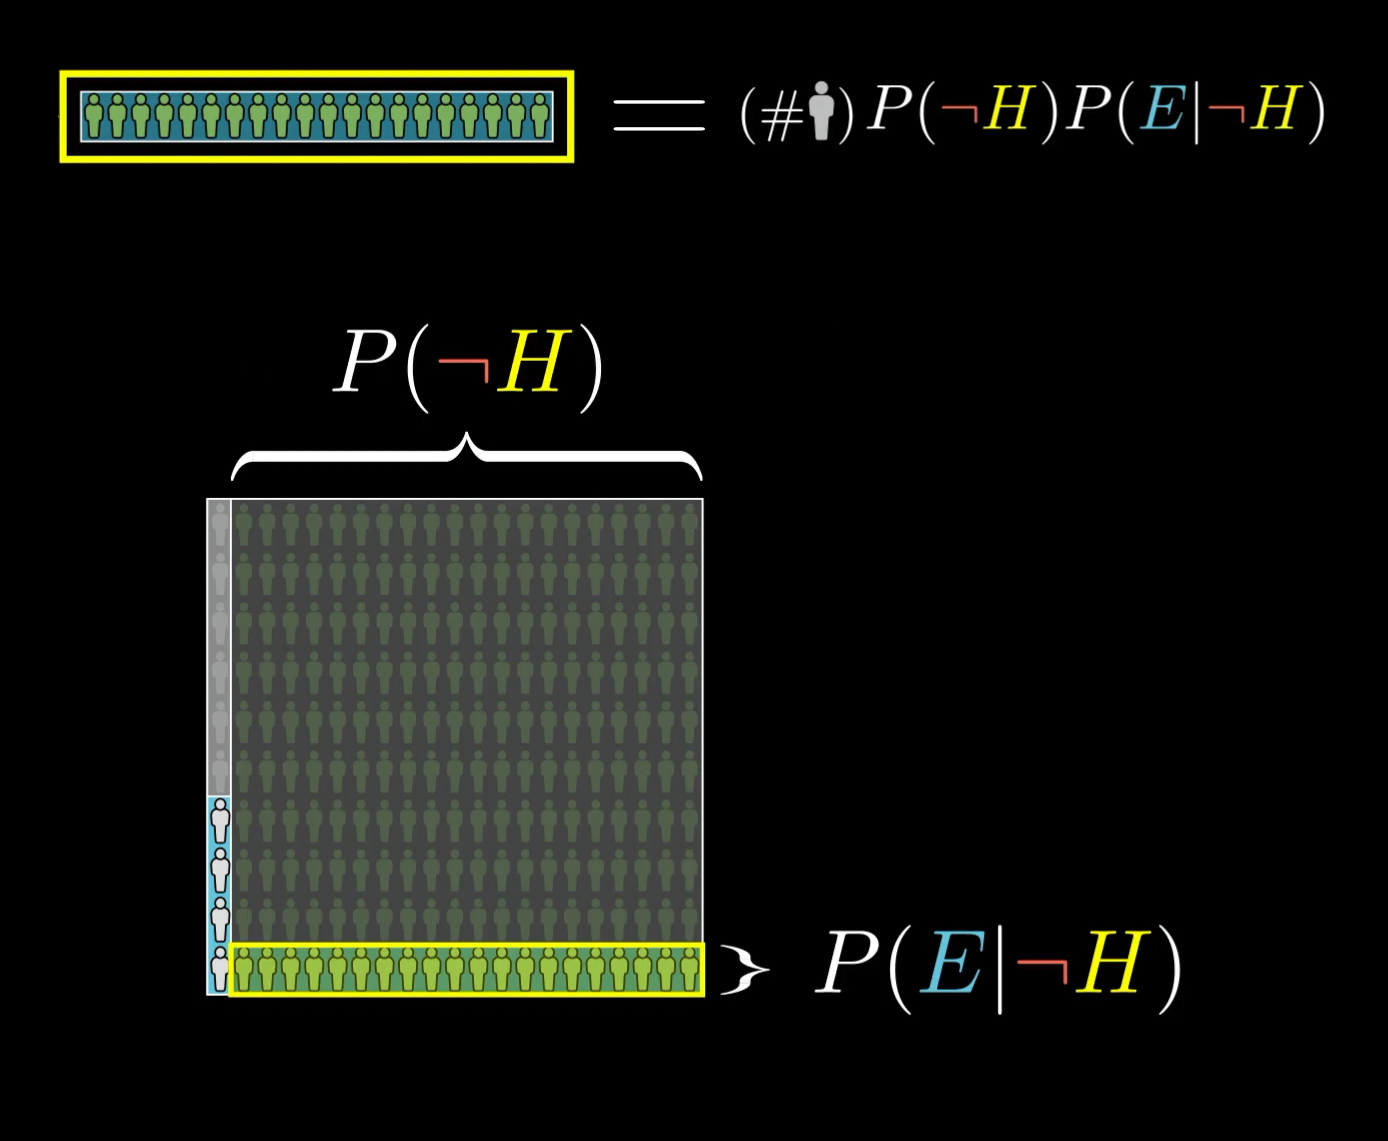
That same number shows up again in the denominator. But we also need to add in the other number, which in our example was 20. That came from the total number of people times the proportion who are not librarians, times the proportion of those who fit the evidence.
Once we have these numbers, we can assemble them into the Bayes' theorem fraction:

The total number of people in our example, 210, gets canceled out—which of course it should, given that it was just an arbitrary choice we made for illustration—leaving us finally with the more abstract representation purely in terms of probabilities.
This, my friends, is Bayes’ theorem.
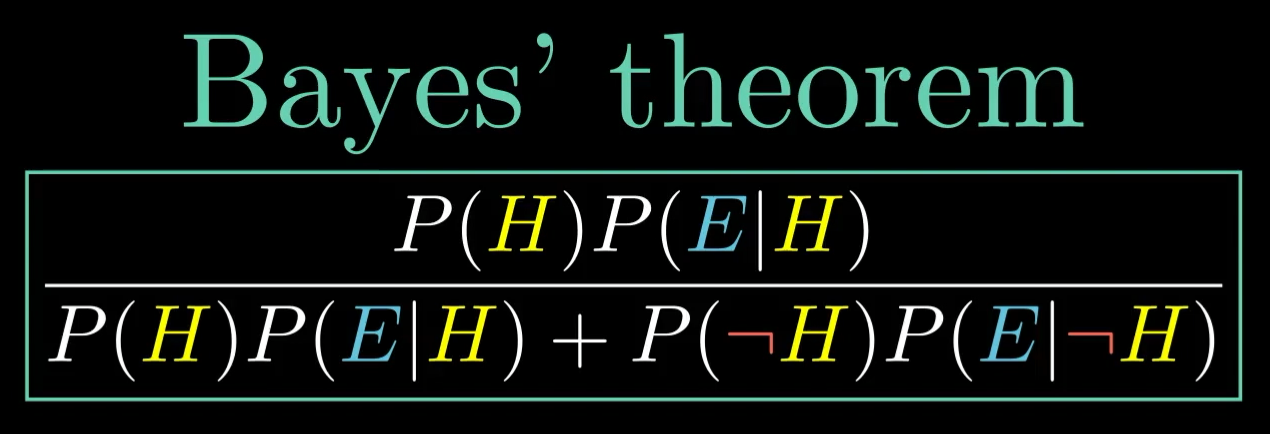
You often see that big denominator written more simply as , the total probability of seeing the evidence. In practice, to calculate it, you almost always have to break it down into the case where the hypothesis is true, and the one where it isn’t.

Piling on one final bit of jargon, this final answer is called the “posterior”; it’s your belief about the hypothesis after seeing the evidence.
Writing it all out abstractly might seem more complicated than just thinking through the example directly with a representative sample. And, yeah, it is!
This seems overly complicated...

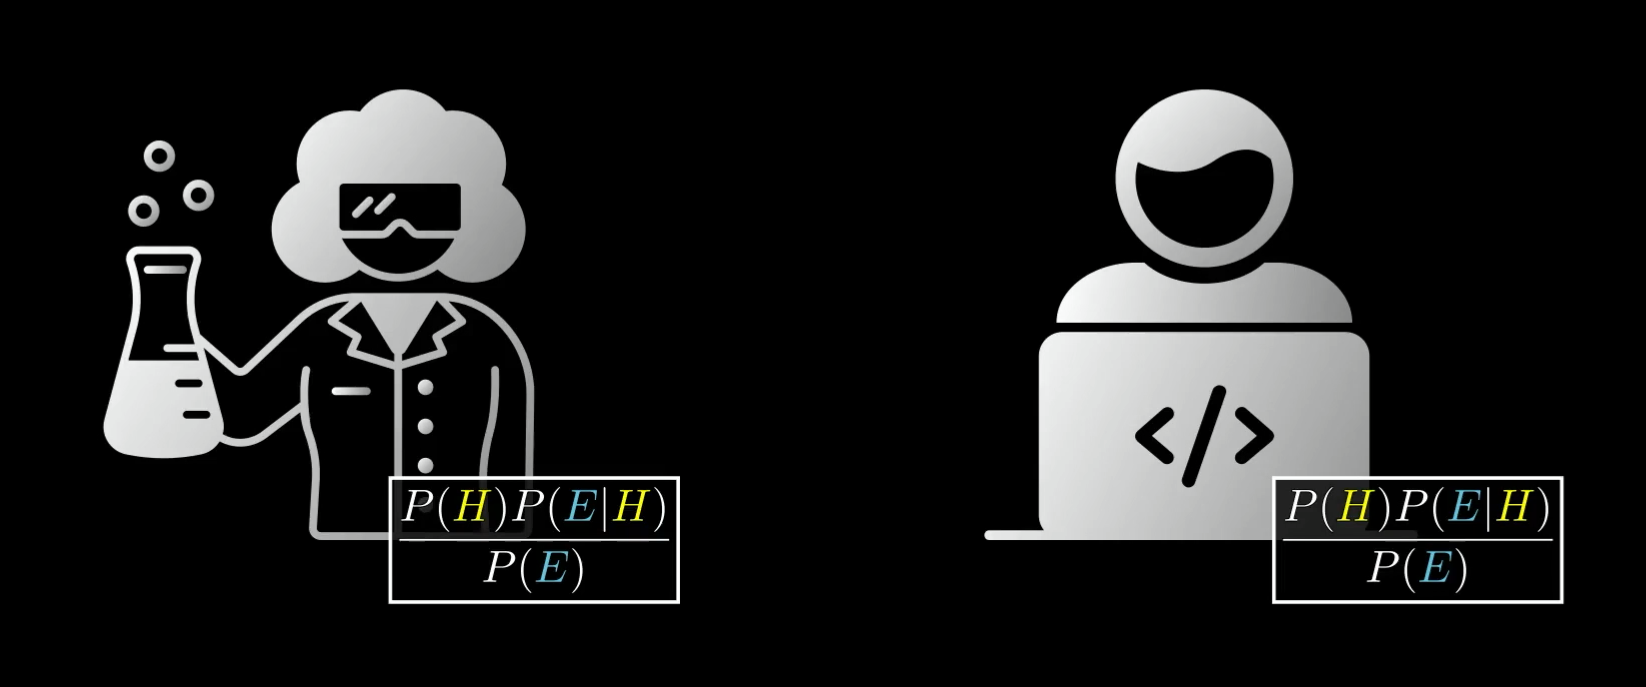
Keep in mind, though, the value of a formula like this is that it lets you quantify and systematize the idea of changing beliefs. Scientists use this formula when analyzing the extent to which new data validates or invalidates their models. Programmers use it in building artificial intelligence, where you sometimes want to explicitly and numerically model a machine’s belief.
And honestly? Just for the way you view yourself, your own opinions, and what it takes for your mind to change, Bayes’ theorem has a way of reframing how you think about thought itself.
Also, putting a formula to it becomes all the more important as the examples get more intricate.
Thinking with area
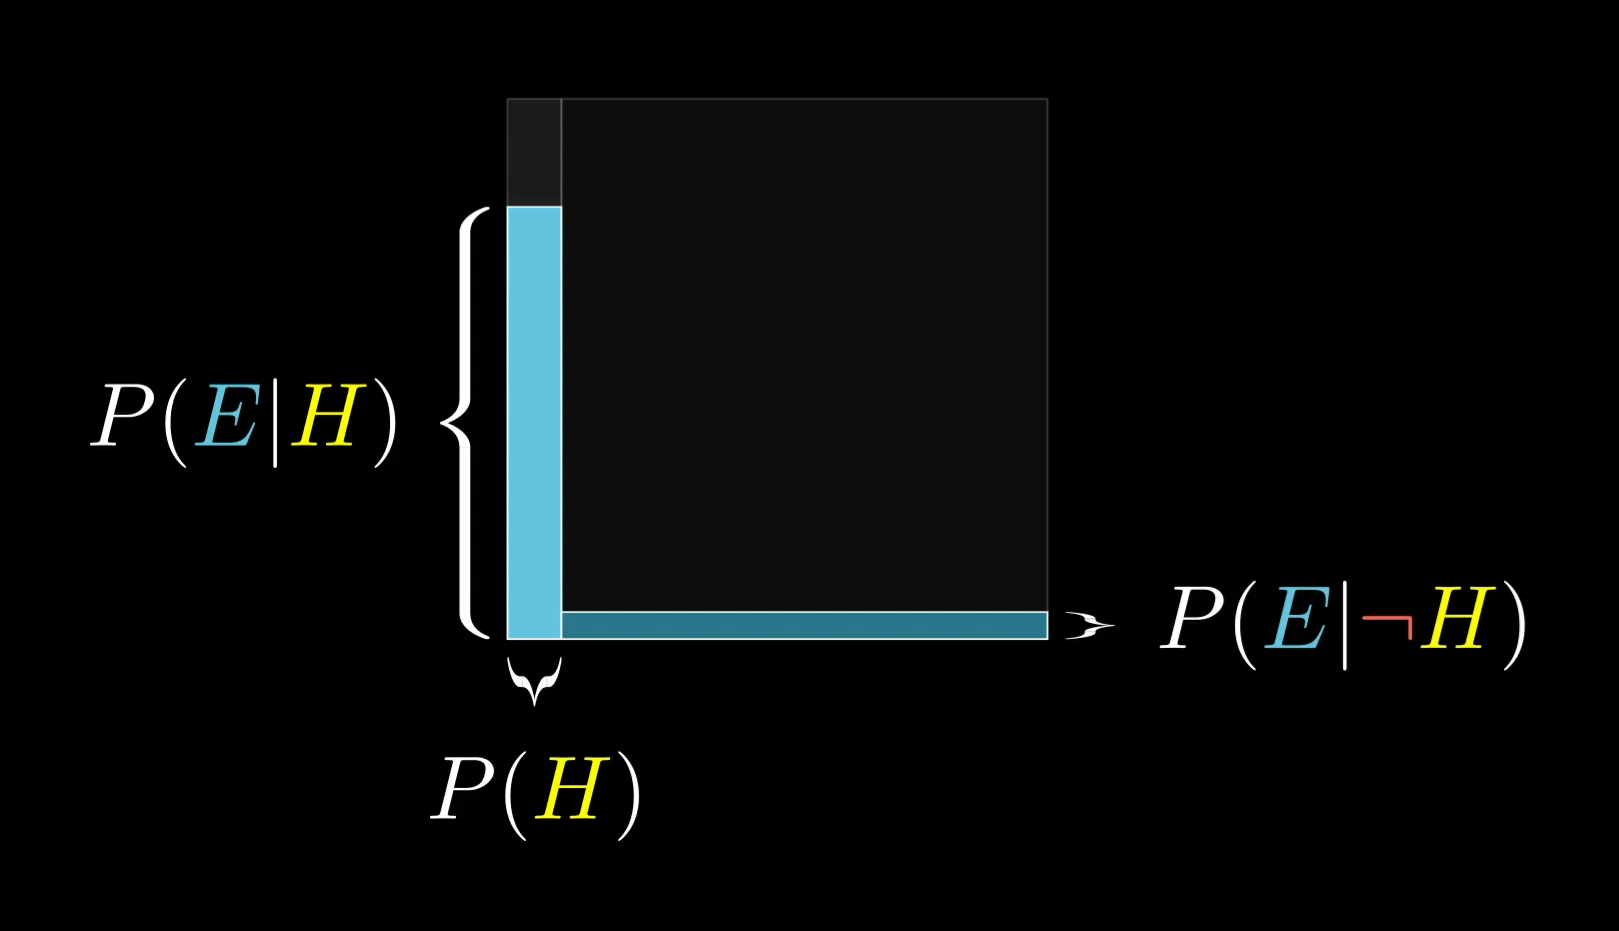
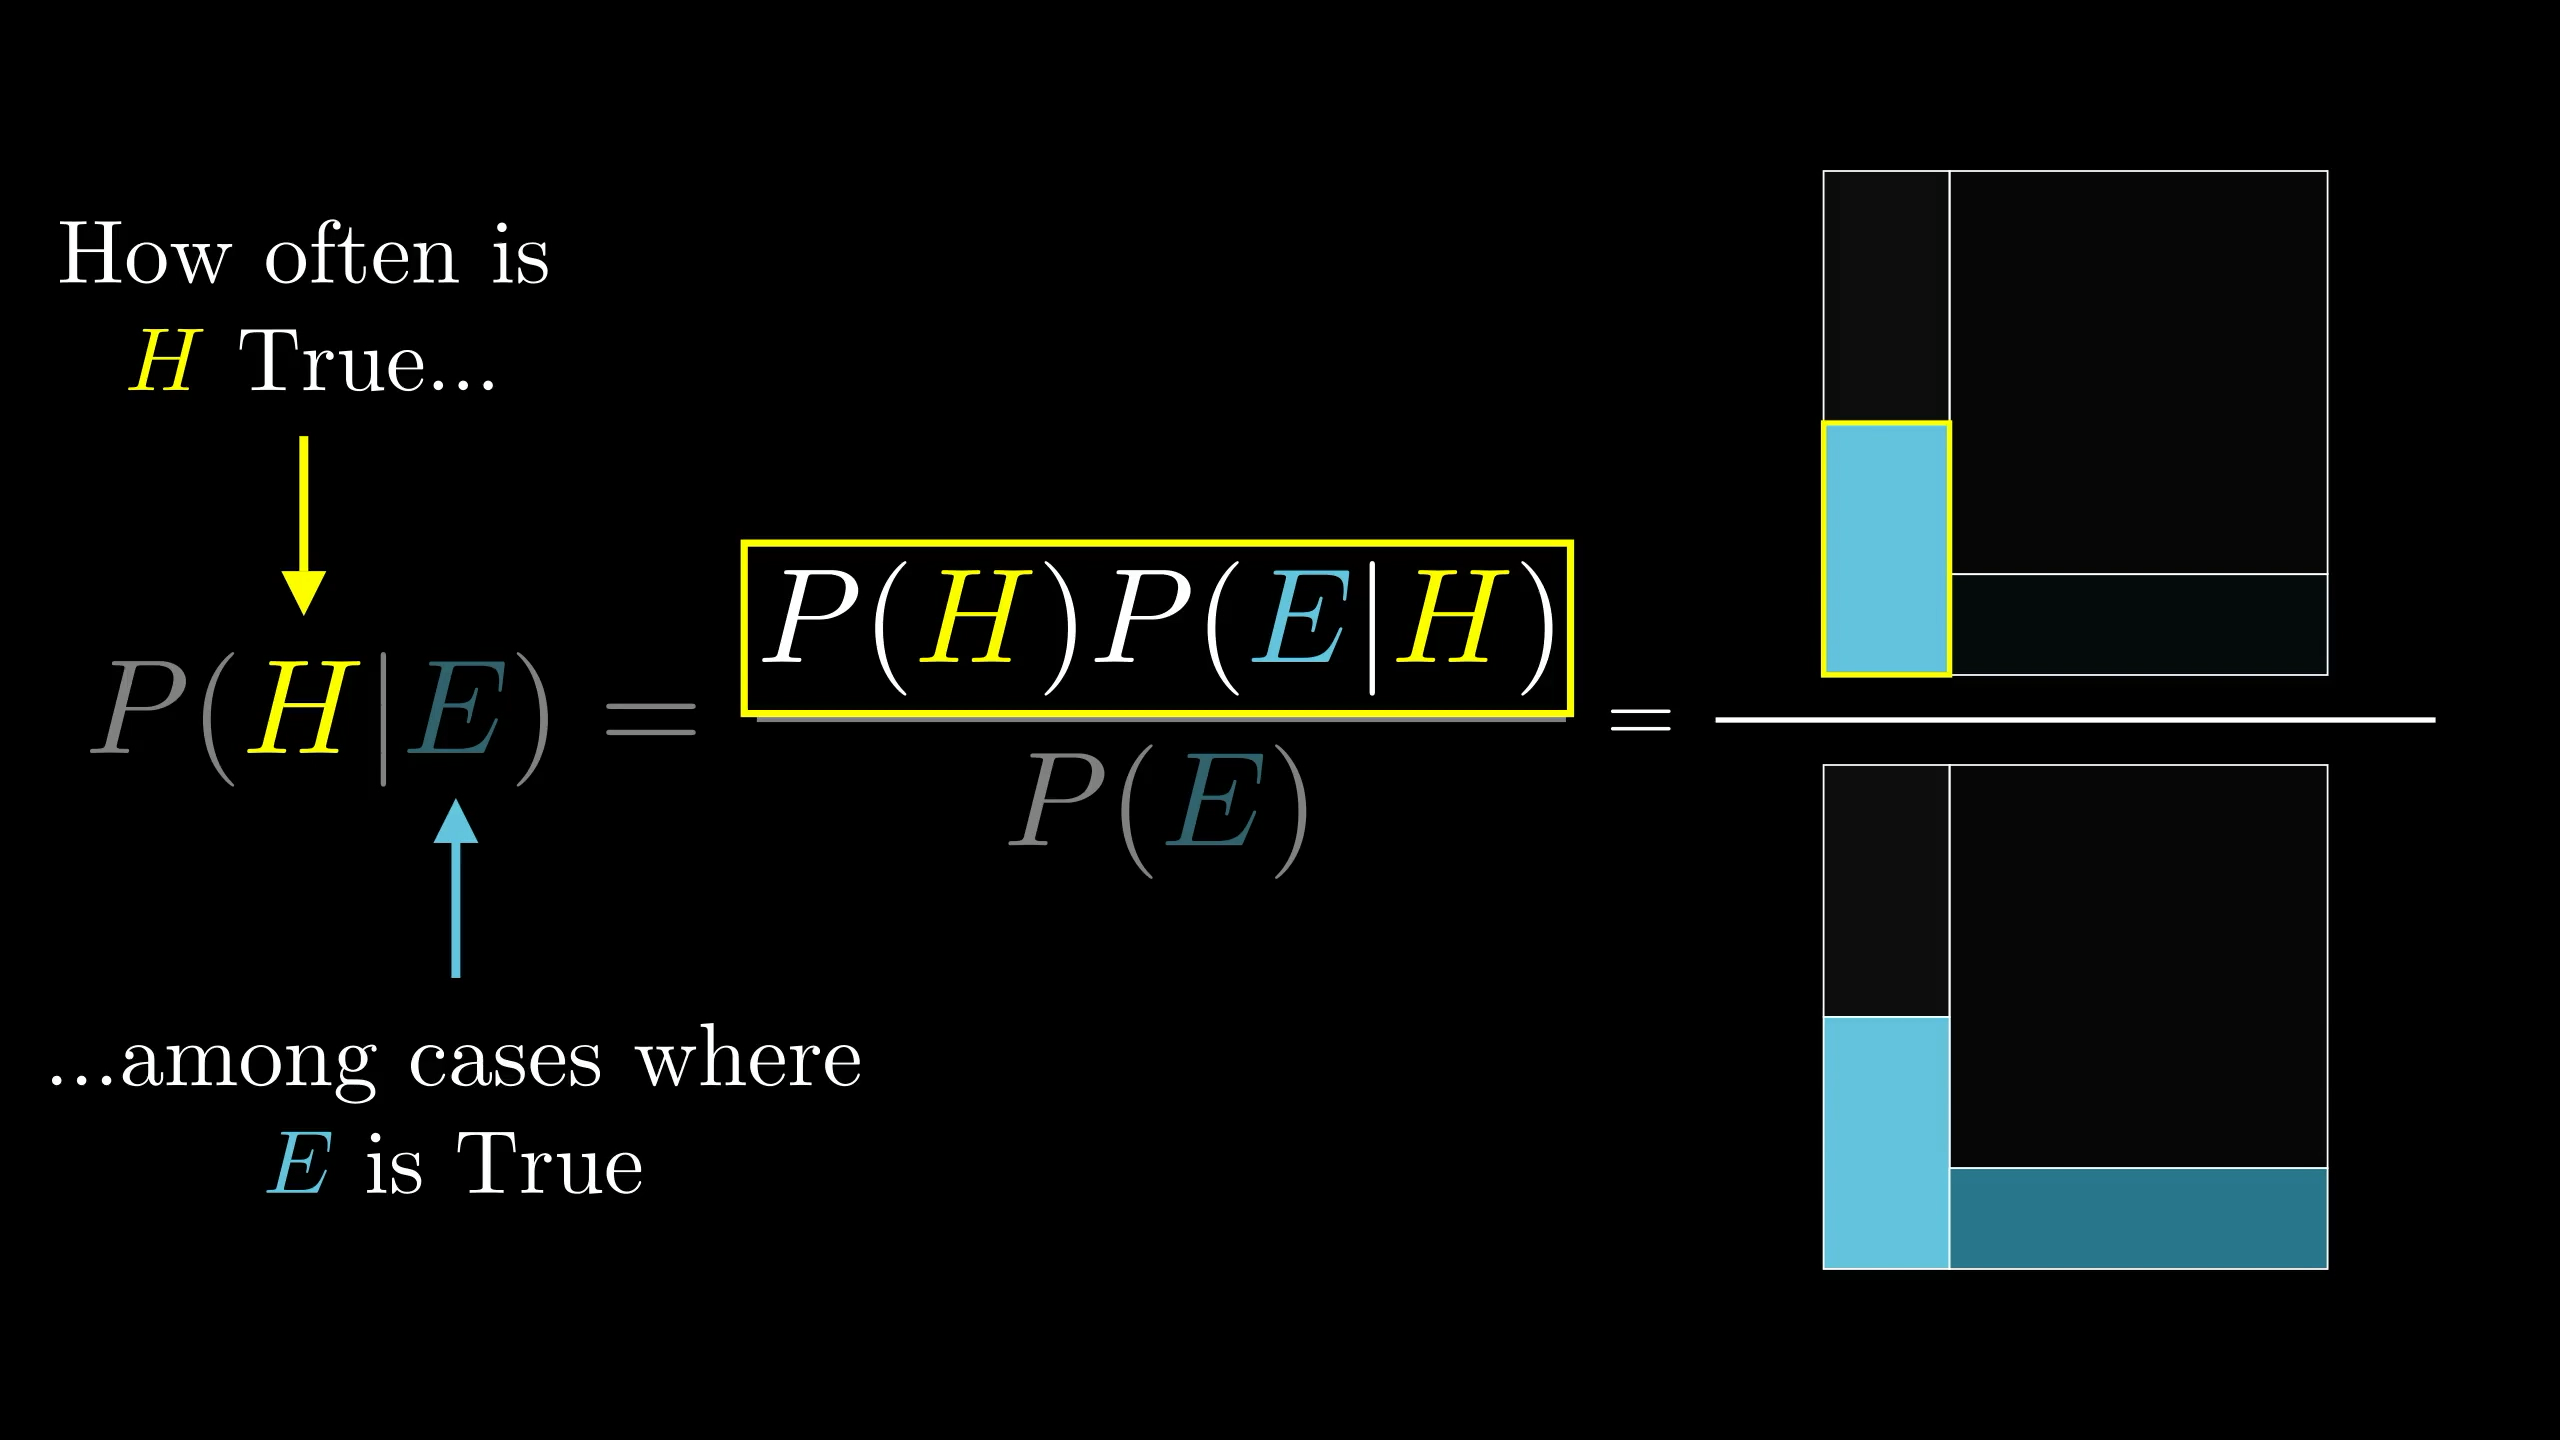
However you end up writing it, I’d actually encourage you not to memorize the formula, but instead to draw out this diagram as needed.
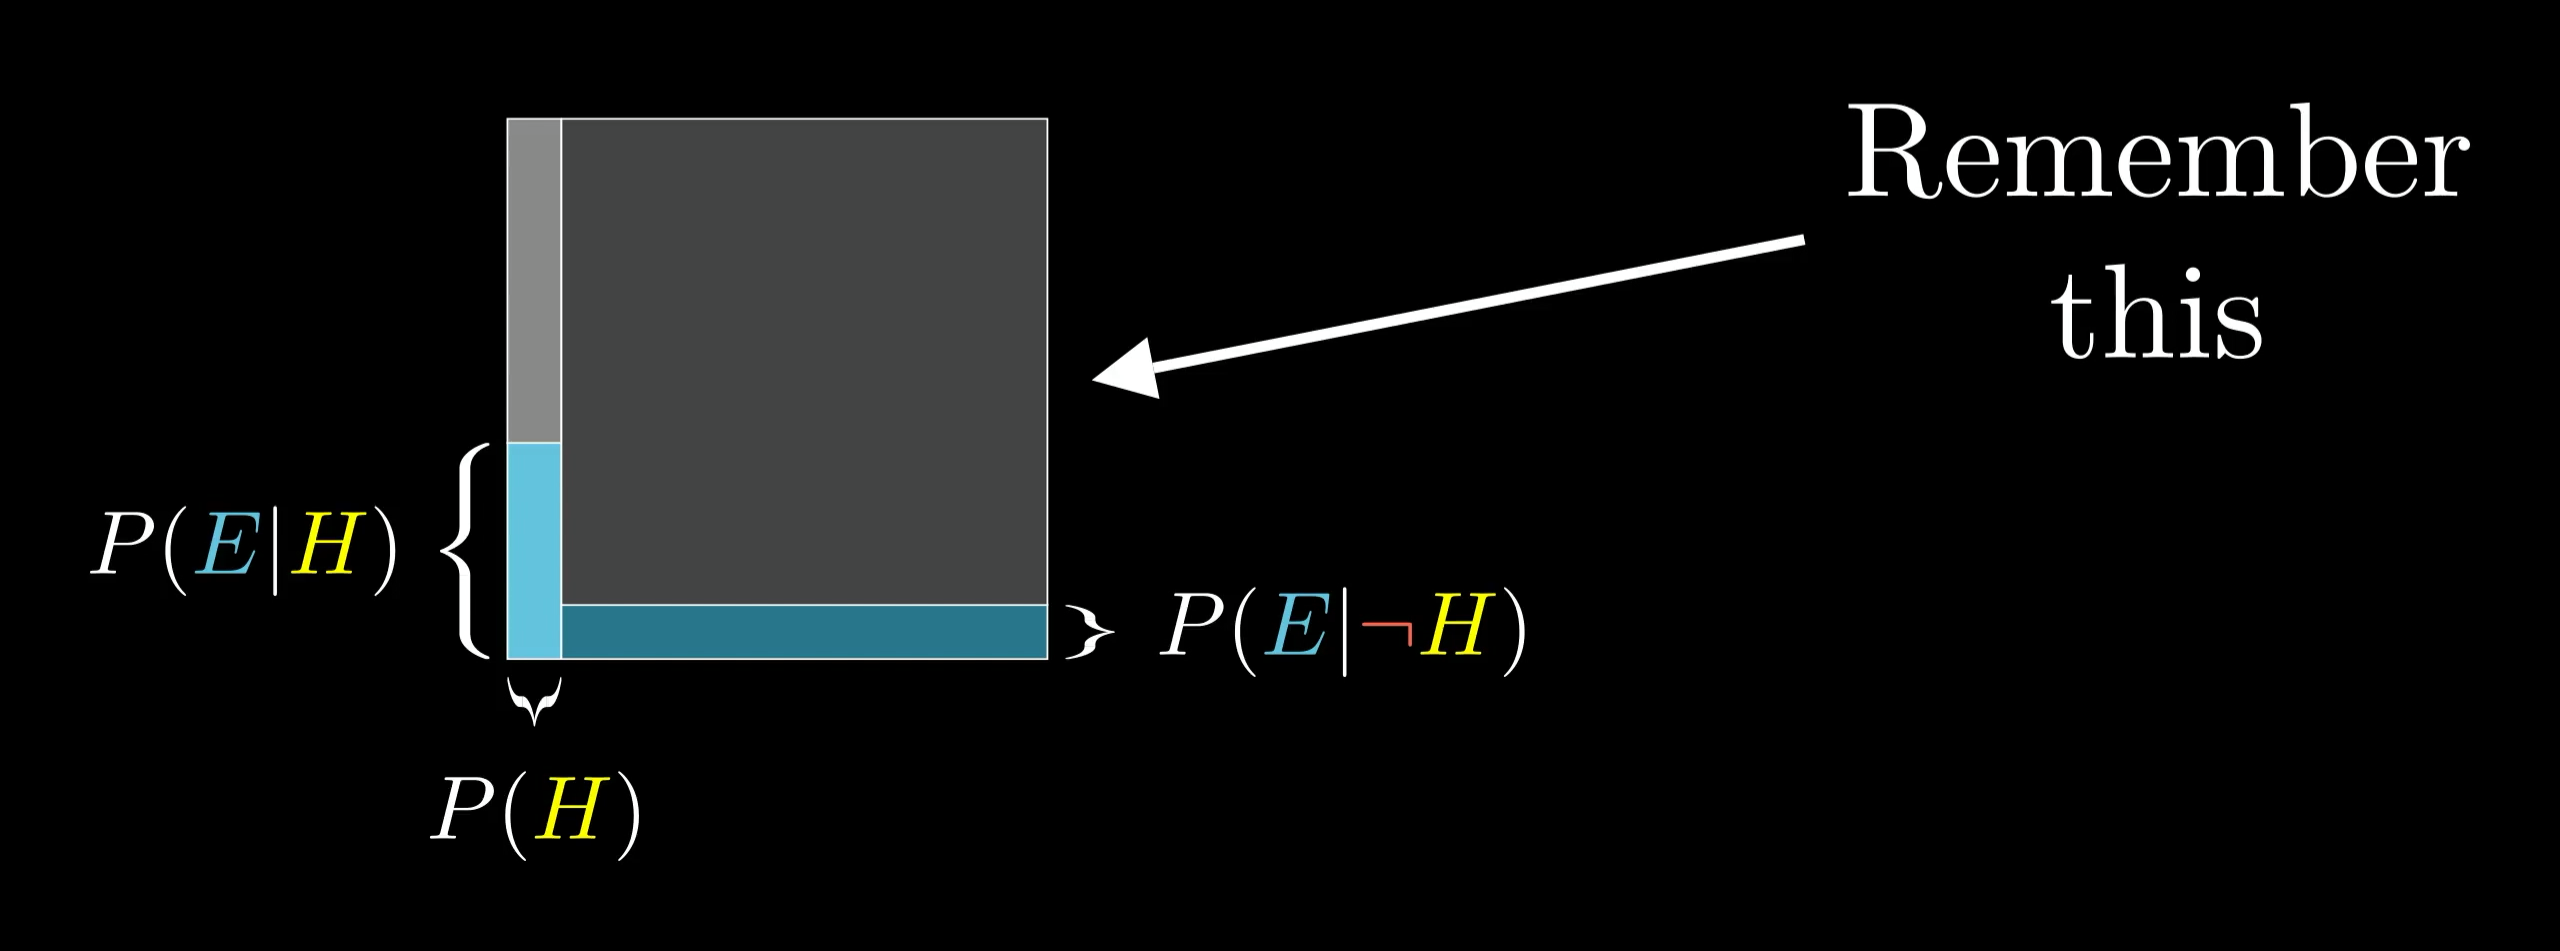
This is sort of the distilled version of thinking with a representative sample. Here, we think with areas instead of counts, which is more flexible and easier to sketch on the fly. Rather than bringing to mind some specific number of examples, like 210, think of the space of all possibilities as a 1x1 square. Any event occupies some subset of this space, and the probability of that event can be thought about as the area of that subset. For example, I like to think of the hypothesis as filling the left part of this square, with a width of .
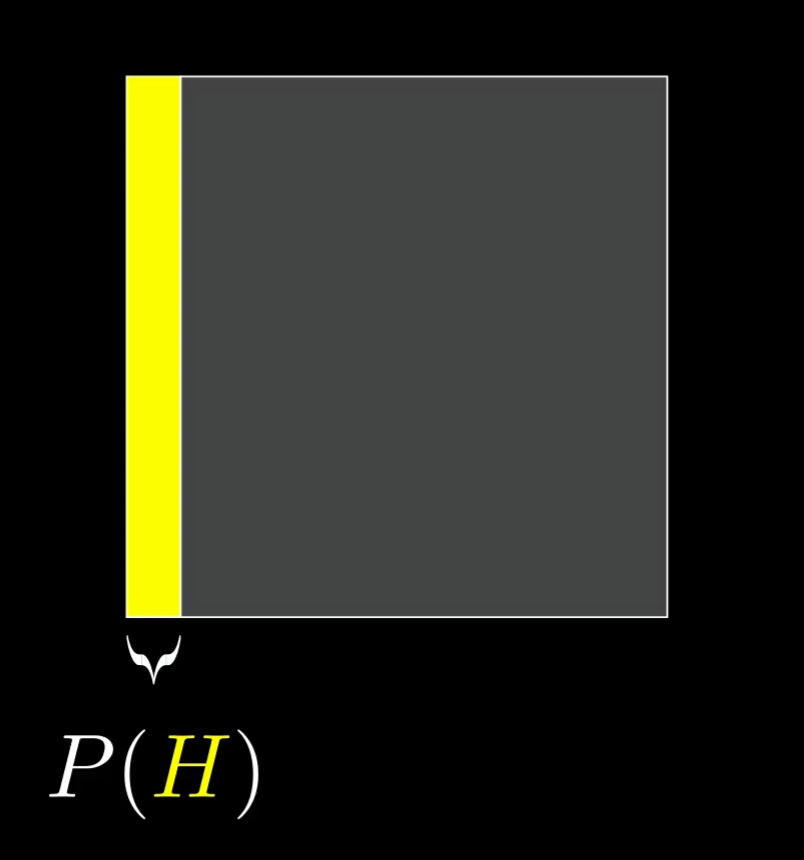
I recognize I’m being a bit repetitive, but it's worth really emphasizing this point: when you see evidence, the space of possibilities gets restricted. Crucially, that restriction may not happen evenly between the left and the right. So the new probability for the hypothesis is the proportion it occupies in this restricted subspace.
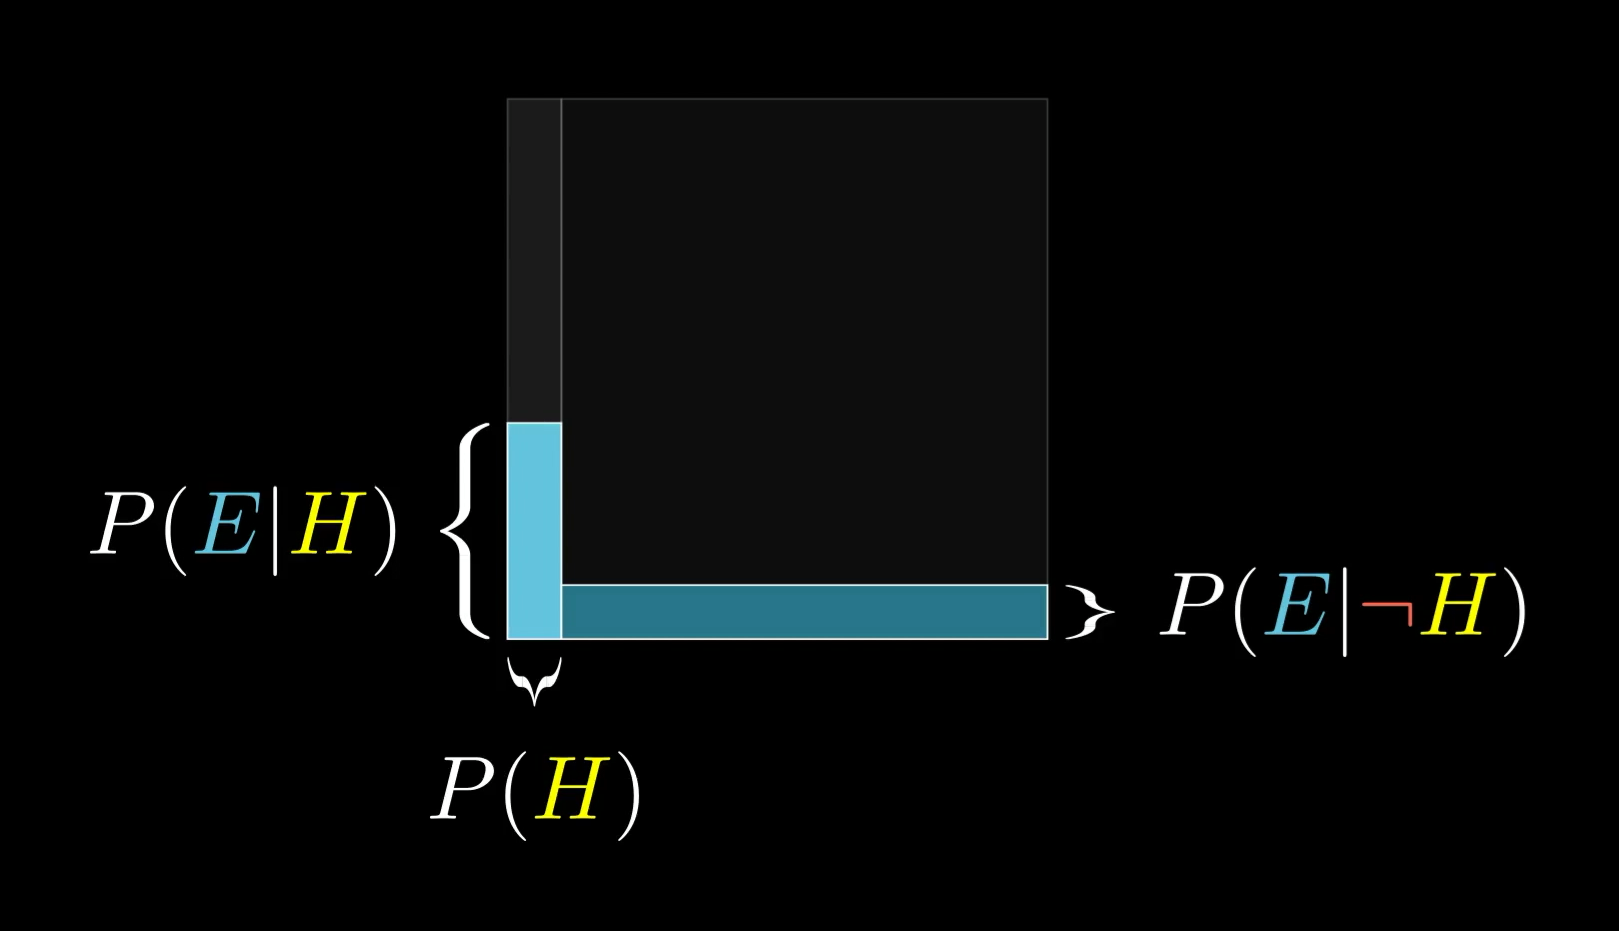
If you happen to think a farmer is just as likely to fit the evidence as a librarian, then the proportion doesn’t change, which should make sense. Irrelevant evidence doesn’t change your belief.
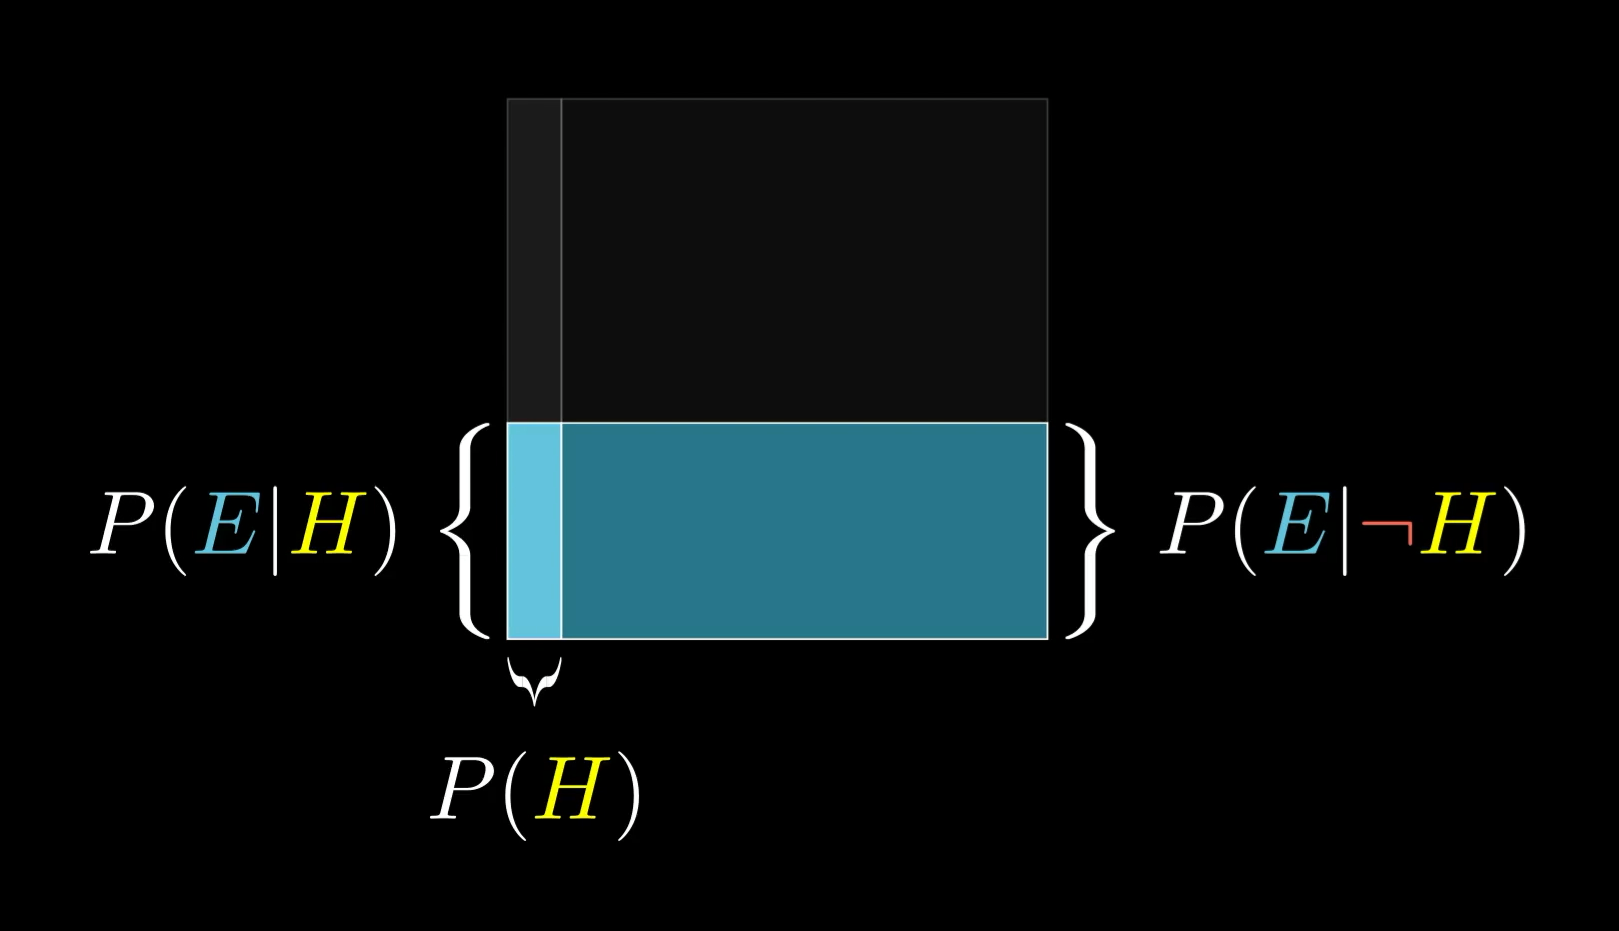
But when these likelihoods are very different, your belief changes a lot.
Step back
This is actually a good time to step back and consider a few broader takeaways about how to make probability more intuitive, beyond Bayes’ theorem. First off, notice just how useful it was to think about a representative sample with a specific number of examples, like our 210 librarians and farmers.
There’s actually another Kahneman and Tversky result to this effect, which is interesting enough to interject here. They did an experiment similar to the one with Steve, but where people were given the following description of a fictitious woman named Linda:
Linda is 31 years old, single, outspoken, and very bright. She majored in philosophy. As a student, she was deeply concerned with issues of discrimination and social justice, and also participated in anti-nuclear demonstrations.
Which is more likely?
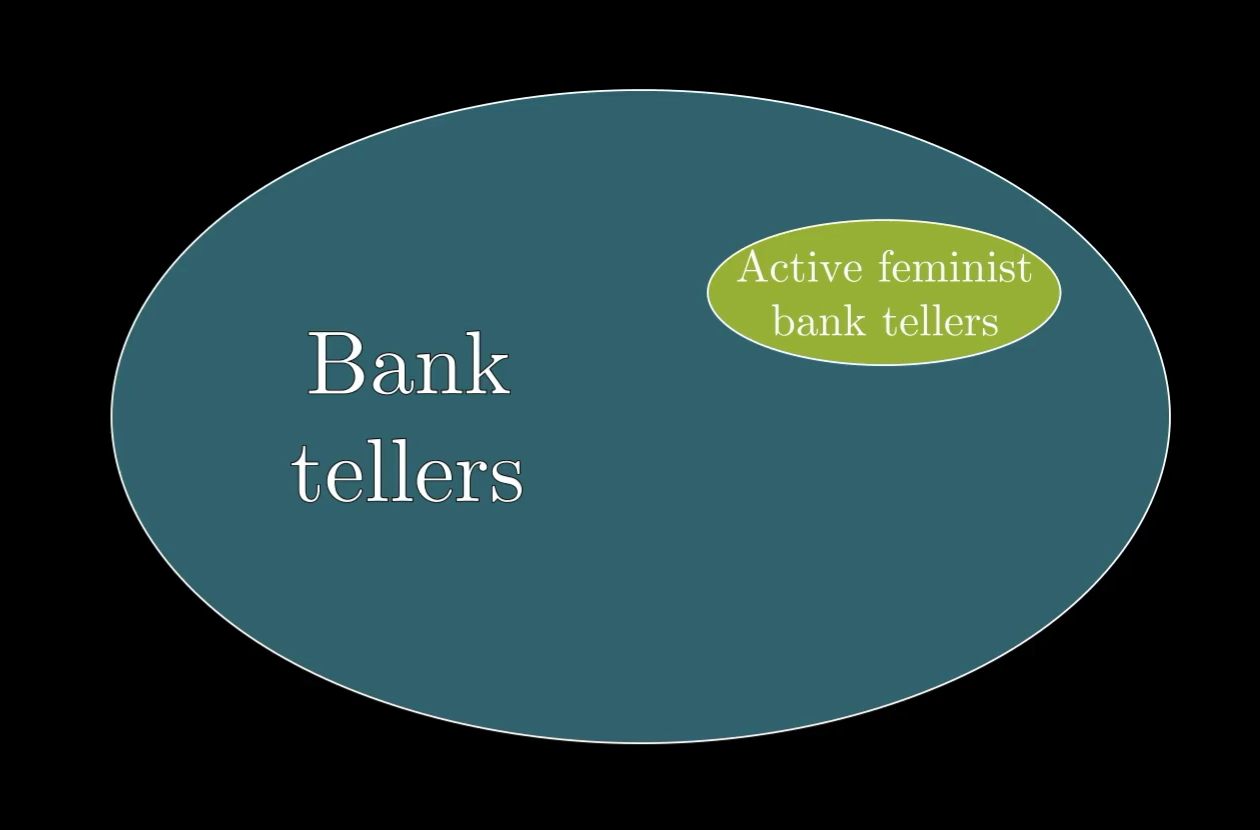
The set of bank tellers active in the femist movement is a subset of the set of all bank tellers.
What’s fascinating is that there’s a simple way to rephrase the question that dropped this error from 85% to 0%. Rather than being asked which case is more likely, participants are instead told that there are 100 people who fit this description, and are asked to estimate how many of those 100 are bank tellers, and how many are bank tellers who are active in the feminist movement.

With this format, no one makes the error. Everyone correctly assigns a higher number to the first option than to the second.
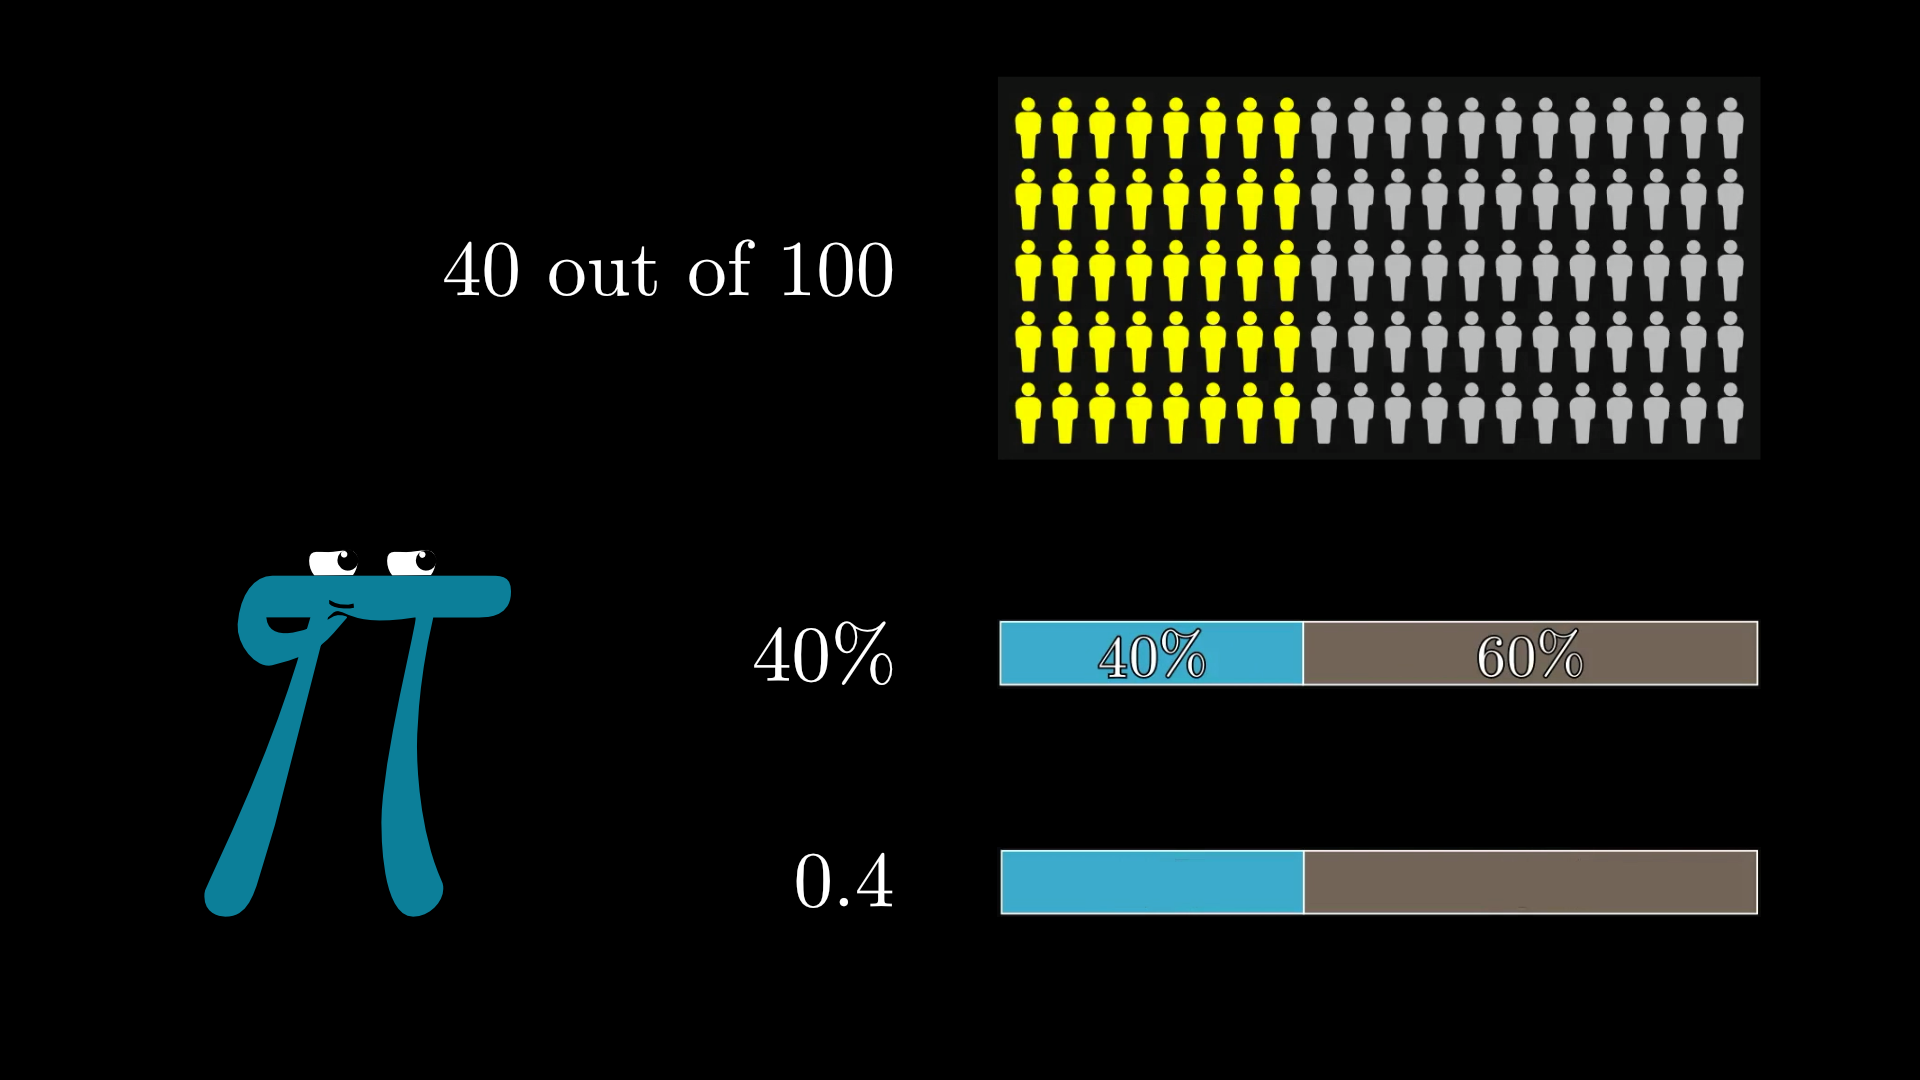
Somehow a phrase like “40 out of 100” kicks our intuition into gear more effectively than “40%”, much less “0.4”, or abstractly referencing the idea of something being more or less likely.
That said, representative samples don’t easily capture the continuous nature of probability, so turning to area is a nice alternative, not just because of the continuity, but also because it’s way easier to sketch out while you’re puzzling over some problem.
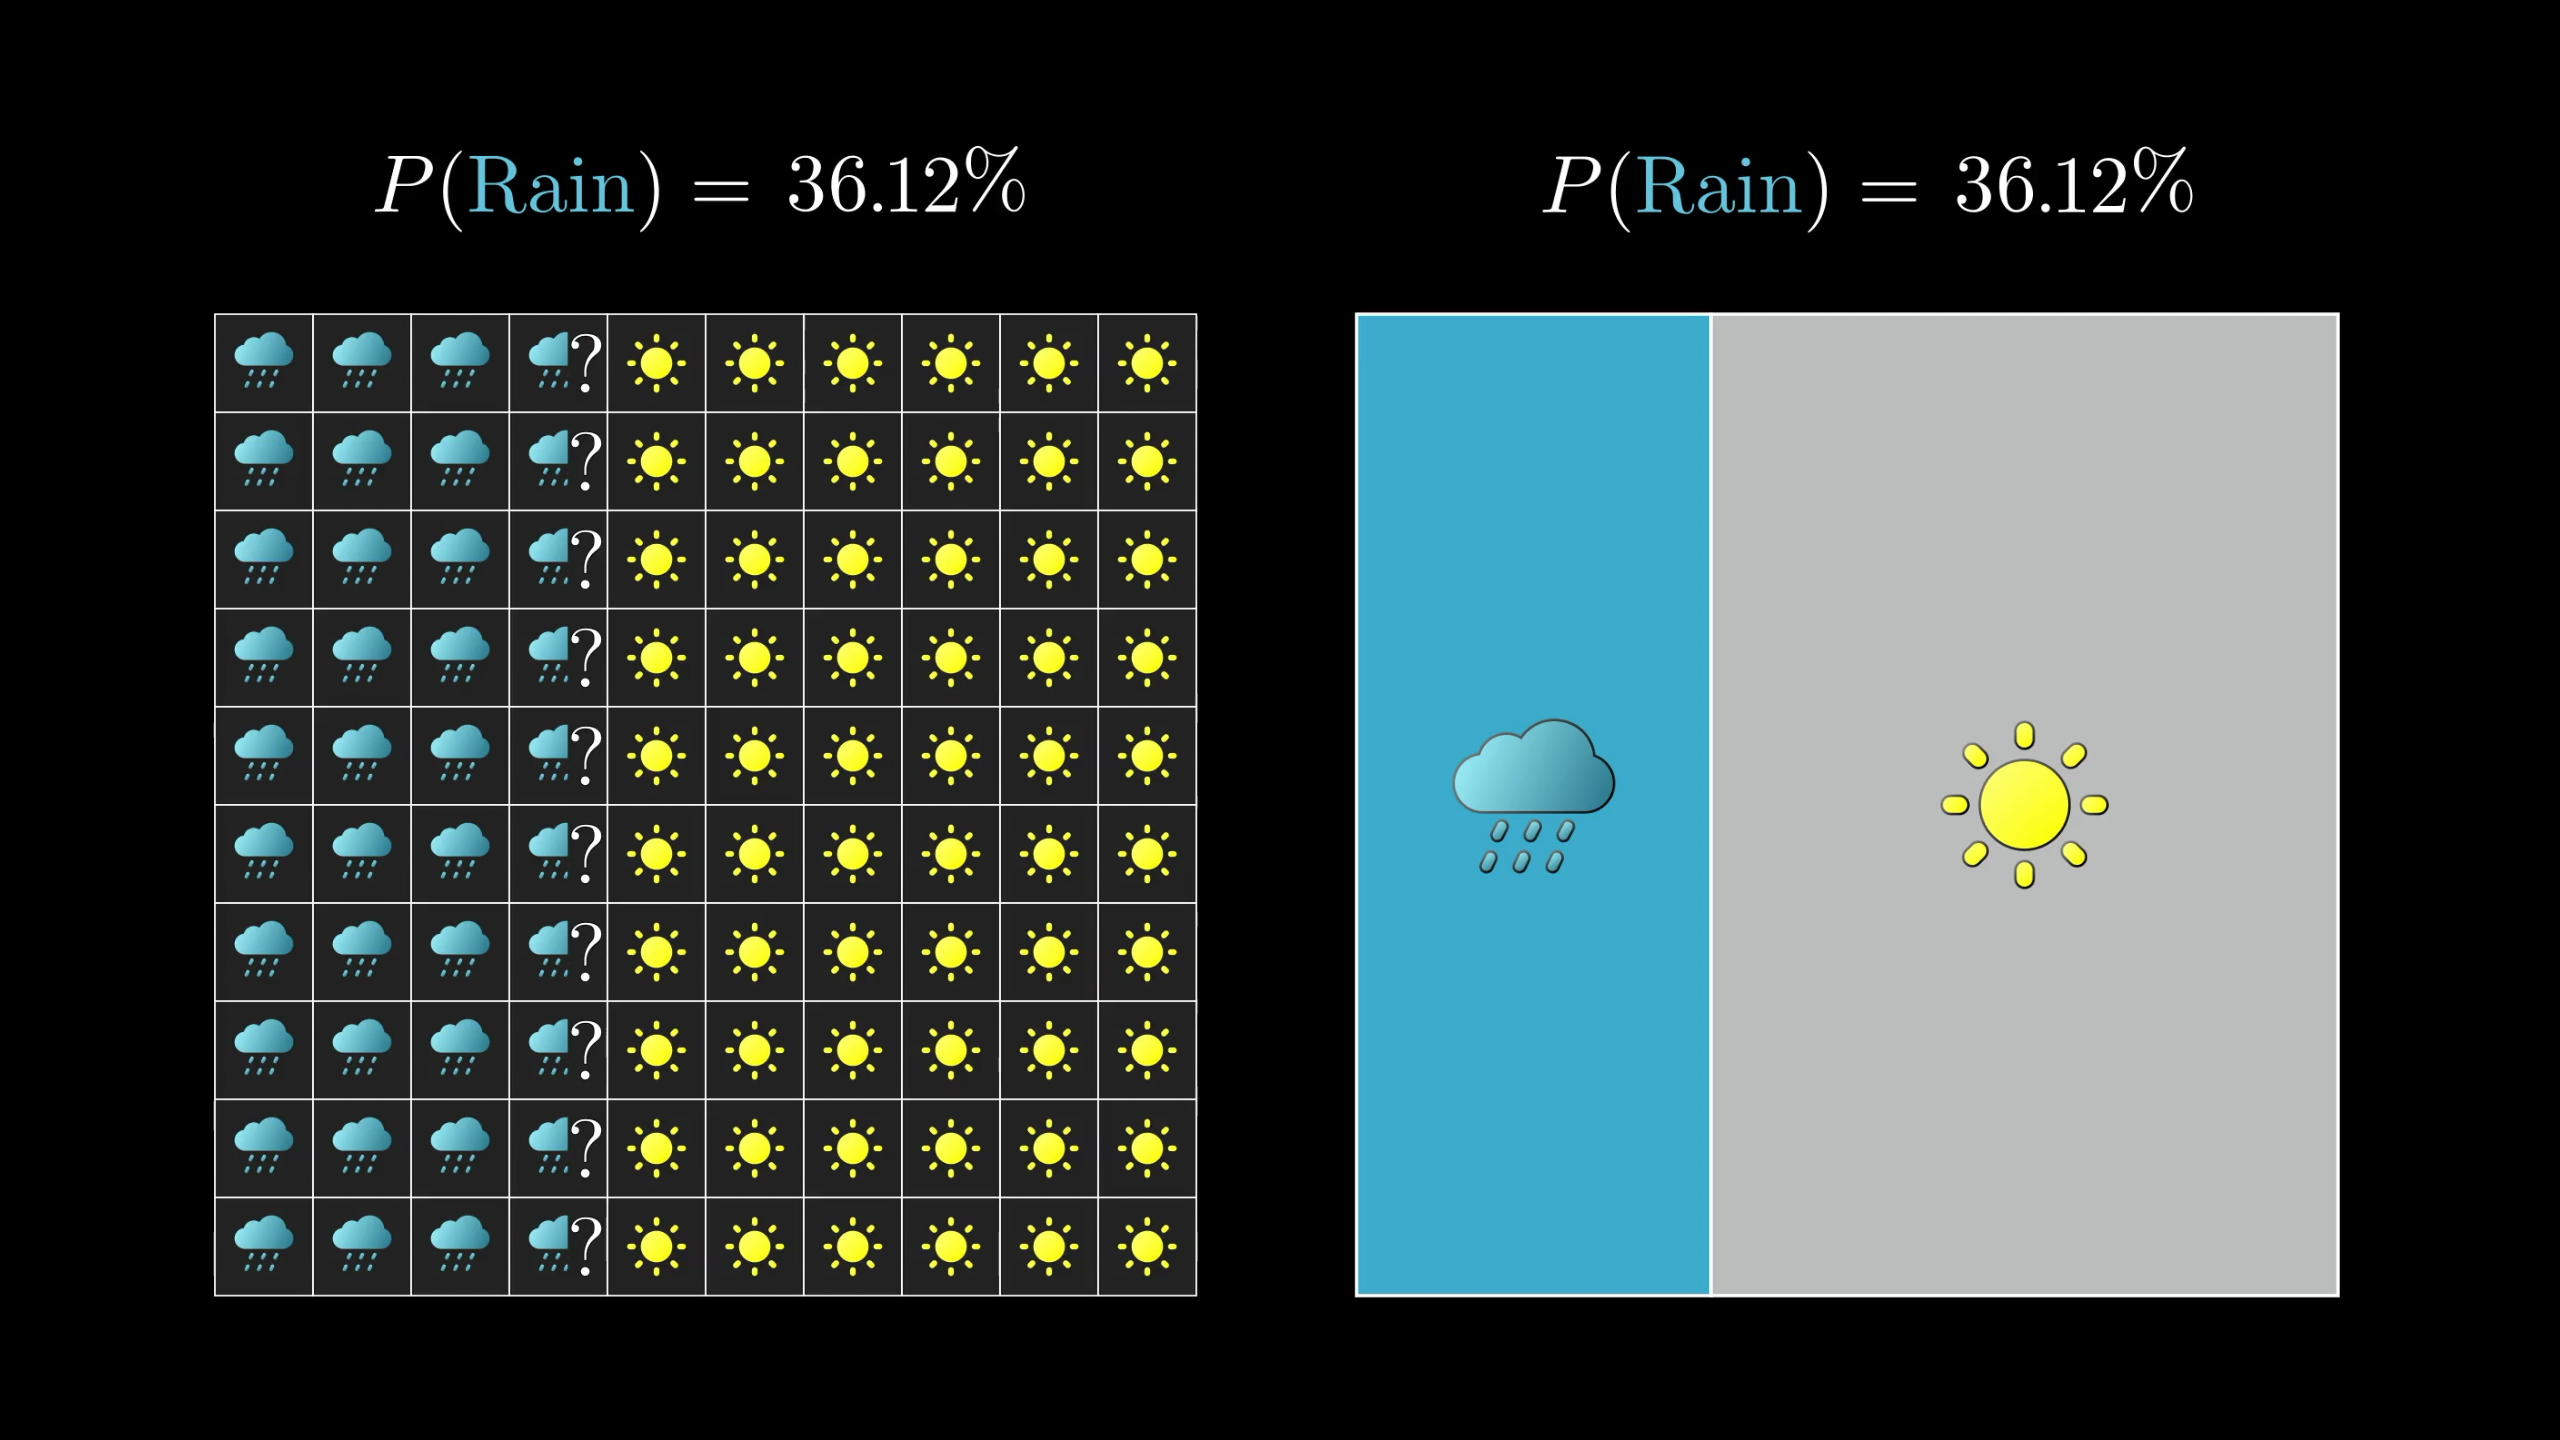
Using area to represent probabilities often works better than imagining taking a sample.
You see, people often think of probability as being the study of uncertainty. While that is, of course, how it’s applied in science, the actual math of probability is really just the math of proportions, where turning to geometry is exceedingly helpful.
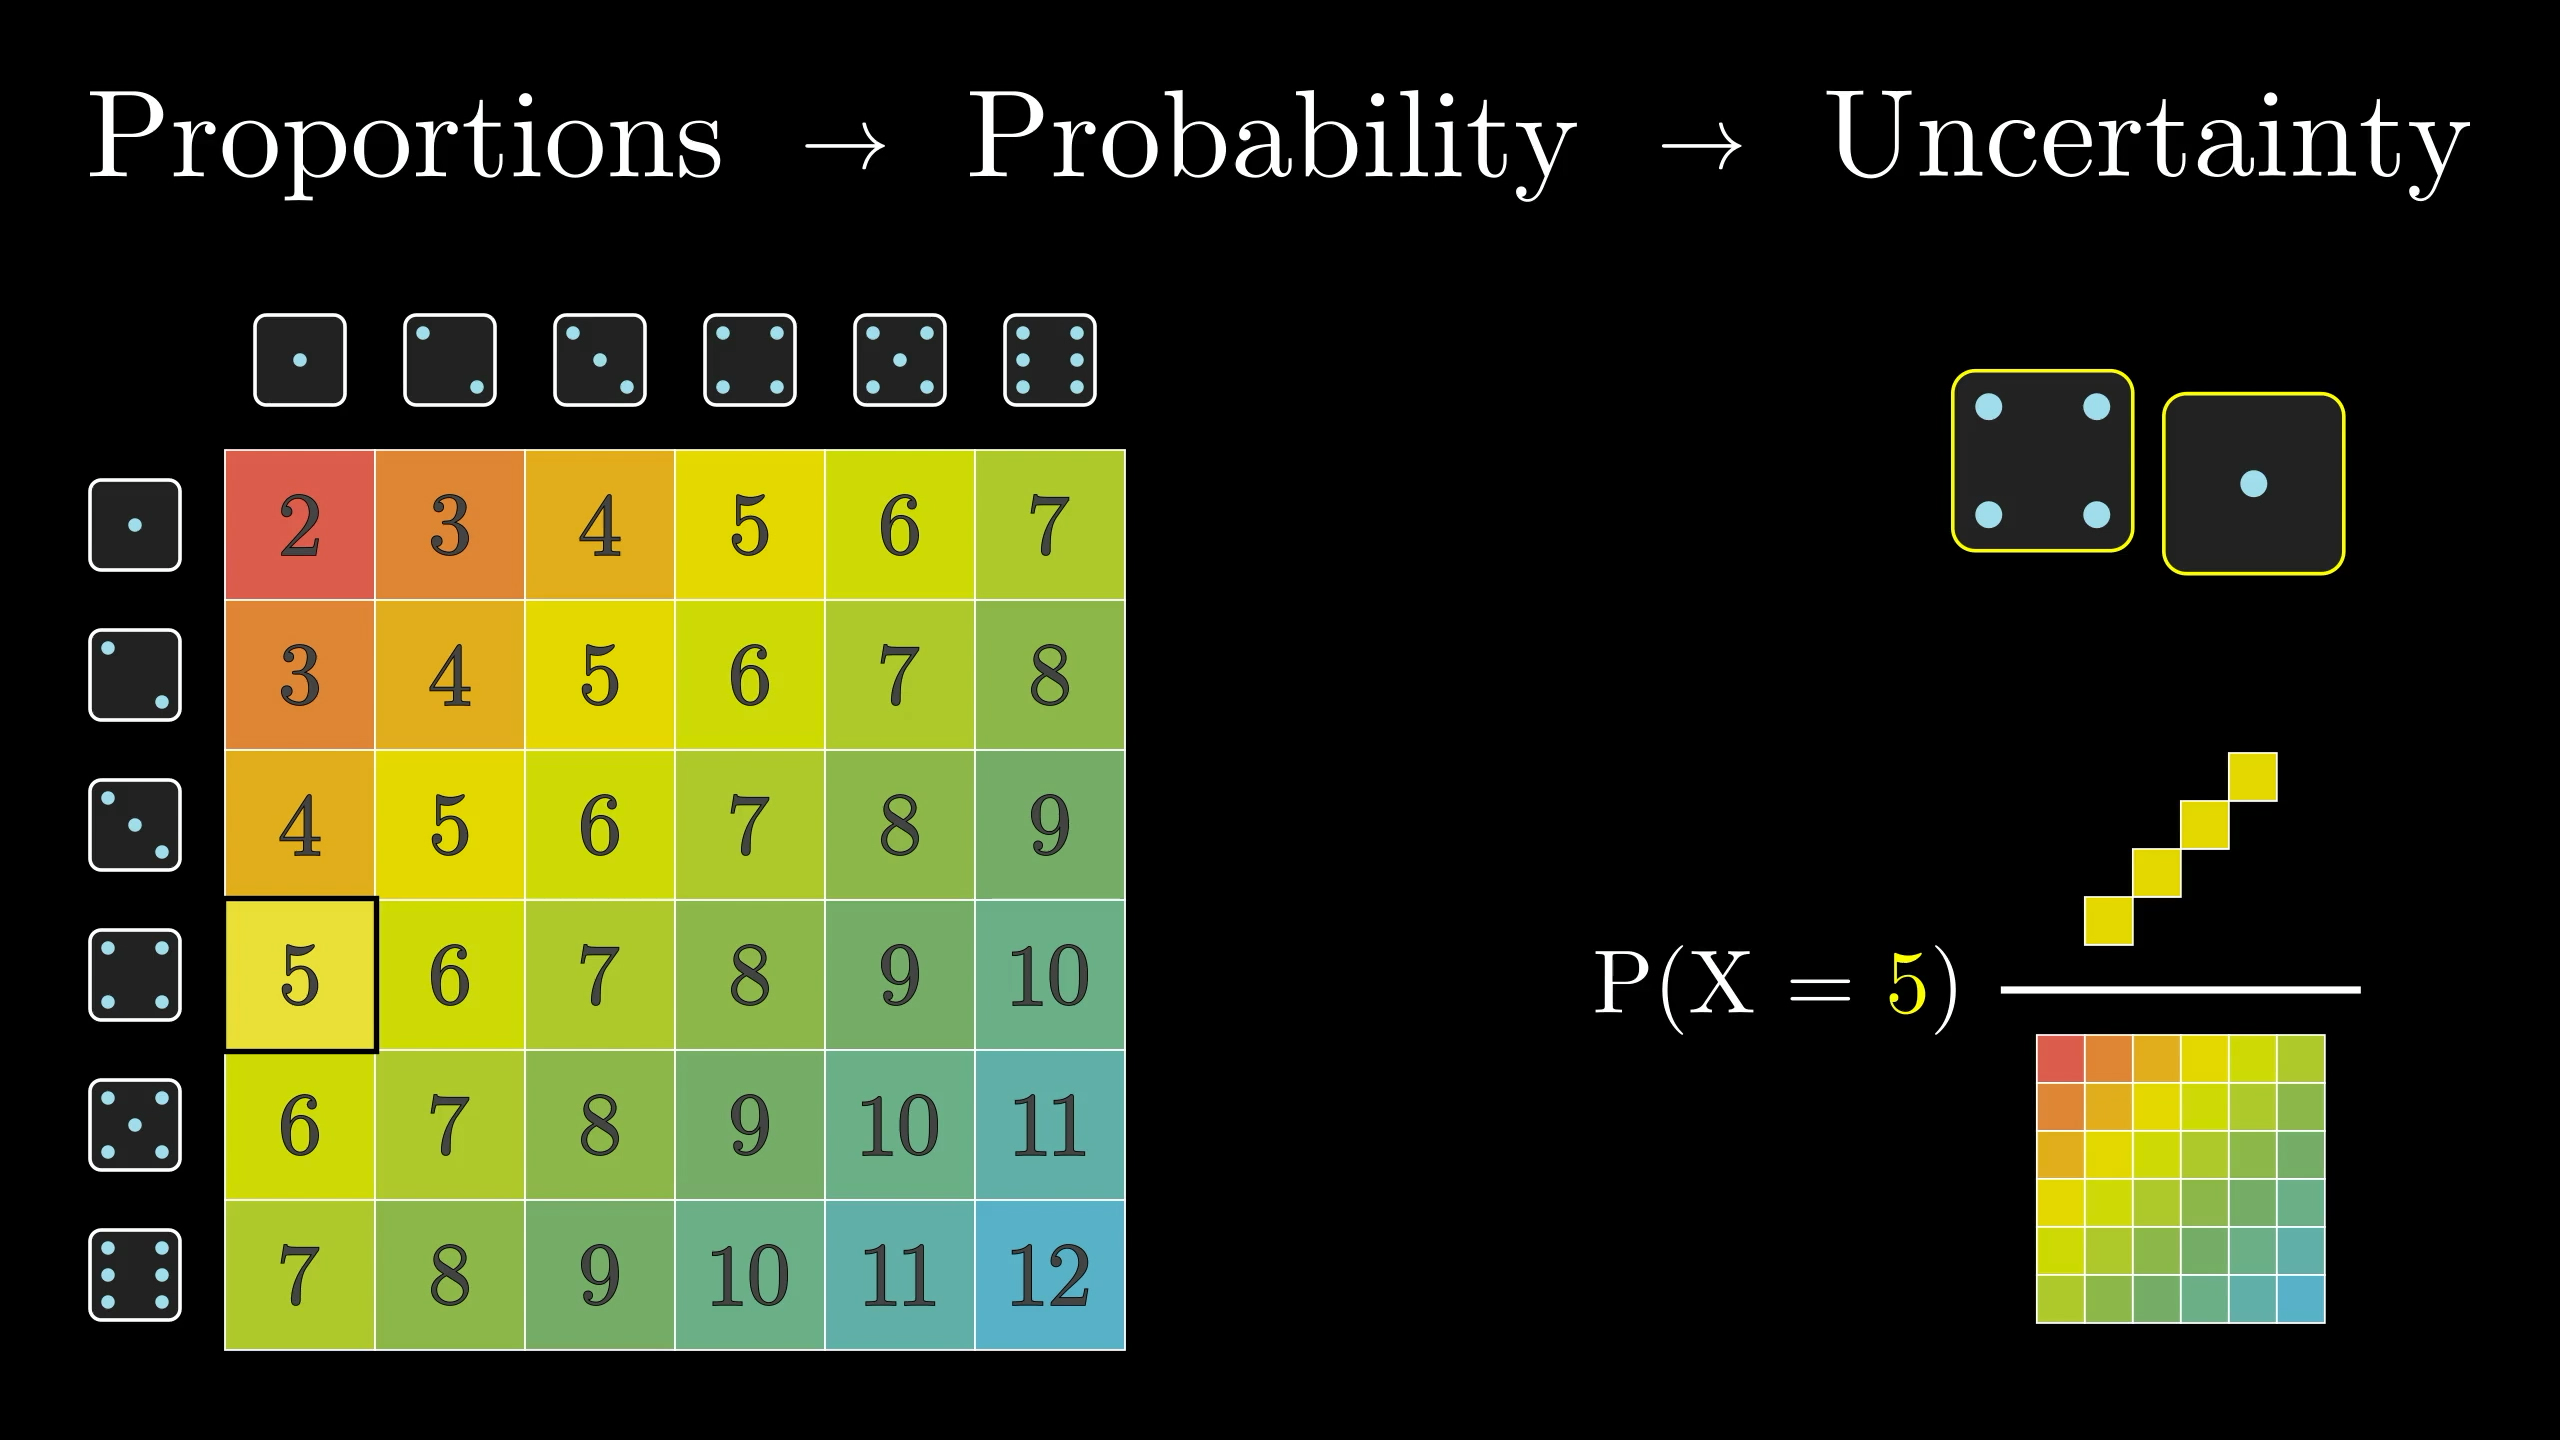
I mean, if you look at Bayes’ theorem as a statement about proportions—proportions of people, of areas, whatever—once you digest what it’s saying, it’s actually kind of obvious. Both sides tell you to look at all the cases where the evidence is true, and consider the proportion where the hypothesis is also true. That’s it. That’s all it’s saying.
What’s noteworthy is that such a straightforward fact about proportions can become hugely significant for science, AI, and any situation where you want to quantify belief.
You’ll get a better glimpse of this as we get into more examples in the next lesson.
Steve's controversy
But before any more examples, we have some unfinished business with Steve. Some psychologists debate Kahneman and Tversky’s conclusion, that the rational thing to do is to bring to mind the ratio of farmers to librarians. They complain that the context is ambiguous. Who is Steve, exactly? Should you expect he’s a randomly sampled American? Or would you be better to assume he’s a friend of these two psychologists interrogating you? Or perhaps someone you’re personally likely to know?
This assumption determines the prior. I, for one, run into many more librarians in a given month than farmers. And needless to say, the probability of a librarian or a farmer fitting this description is highly open to interpretation.
But for our purposes, understanding the math, I want to emphasize that any questions worth debating can be pictured in the context of the diagram. Questions of context shift around the prior, and questions of personalities and stereotypes shift the relevant likelihoods.

Even if the incoming values change, our Bayes' theorem diagram remains a useful tool for calculating probabilities.
All that said, whether or not you buy this particular experiment, the ultimate point that evidence should not determine beliefs, but update them, is worth tattooing in your mind.
I am in no position to say whether this does or doesn’t run against natural human intuition. We’ll leave that to the psychologists. What’s more interesting to me is how we can reprogram our intuitions to authentically reflect the implications of math, and bringing to mind the right image can often do just that.
Thanks
Special thanks to those below for supporting the original video behind this post, and to current patrons for funding ongoing projects. If you find these lessons valuable, consider joining.